
It seems like everyone these days is writing cool ASP.NET web applications. However, we all know that a lot of the real work is still done behind the scenes in background services.
Buying something on Amazon no doubt kicks off a waterfall of tasks that are done behind the scenes to fulfill a single order. Including verifying stock, shipping, contacting product vendors, recording sales statistics, and much more. Background service applications are used by many developers to handle all the less glamorous details of critical business transactions.
For example, at Stackify, we have probably three times as many servers that do background processing than we do web servers. Our web servers receive a lot of data and simply queue it up for Windows Services to process behind the scenes. Monitoring our Windows Services and their business transactions is mission-critical to us.
In this guide, we are going to walk through how to monitor your critical Windows Services.
Monitoring Windows Services is much different than monitoring ASP.NET applications. Web applications have very defined “transactions” based on each ASP.NET web request. It is very simple for services like Retrace to identify each individual web request and track the performance of them.
Windows Services have no defined start or end to the work that they do. They typically start and run continuously until the server is turned off. To properly monitor the performance of your Windows Services, you need to define the start and end of the transactions or “operations” they are performing.
Note: Windows Services can be used to “self host” ASP.NET web applications without IIS. In these use cases, tracking web requests can be done similarly as they are for ASP.NET without and special definition of the transactions.
Windows Services usually follow several common usage patterns. By identifying these patterns, you can quickly evaluate the best way to identify operations in your code.
Think of an operation as a unit of work that is repeated over and over. You need to identify them and then potentially monitor each different operation that your service executes.
Common usage patterns:
Most Windows Services are likely to perform multiple operations. I would suggest breaking them down to the smallest logical units of work. It is better if you monitor smaller units of work. This is similar to monitoring each web request in your ASP.NET application versus monitoring the performance of the application as a whole.
For example, our monitoring agent for Windows is a Windows Service. It does a ton of different operations on a schedule every few seconds. Each one of those tasks that it performs should be defined as unique operations so you can track everything that it does.
Once you have identified the operations you would like to track, you will need to make a few minor code changes. Retrace relies on using Stackify’s StackifyLib NuGet package to define the operations in your code. Basically, you just wrap your code with an object and give it a name.
Example of instrumenting your code for Retrace:
For more information and code examples, please see our docs about using Retrace for tracking non-web transactions.
Retrace utilizes lightweight .NET profiling and other data collection techniques. It is installed as a service on your Windows Server and runs in the background. All you need to do is run the installer and input your Stackify API key to get Retrace up and running.
By default, Retrace automatically monitors ASP.NET web applications running in IIS. For Windows Services, you need to tell it which applications it needs to profile. See our docs for details on how to do that. Retrace is designed for Windows Services performance monitoring and provides many benefits for developers.
For more details on how to install Retrace for Windows Services, please consult our docs.
Once your code has been instrumented and Retrace is collecting data about your Windows Service, you can get some amazing details about what your code is doing.
Retrace automatically supports most common .NET dependencies and frameworks with no code changes. You can instantly see how they are being used by your application and how they impact performance. This includes SQL Server, Oracle, external web services, MongoDB, Elasticsearch, Redis, Azure PaaS services, and much more.
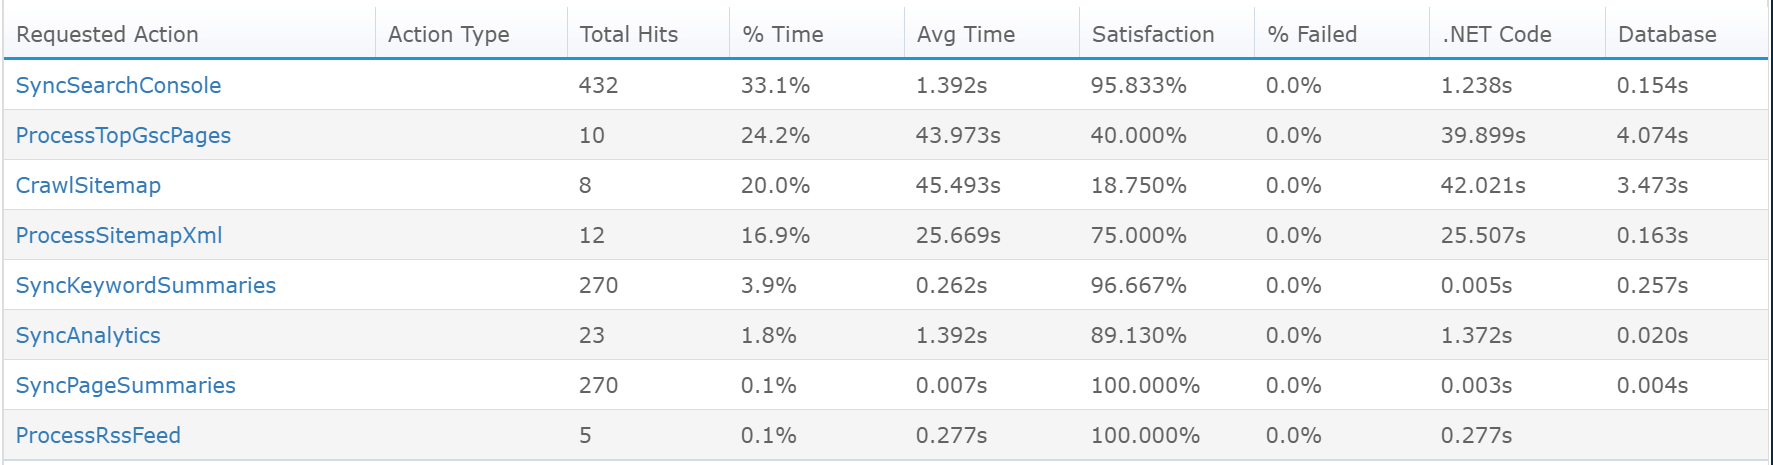
Retrace allows you to see all the operations being executed within your Windows Service. Quickly identify how often each of them are executed, average run time, and much more. The performance of Windows Service is typically a “black box”. Retrace enables you to understand exactly what your service is doing.
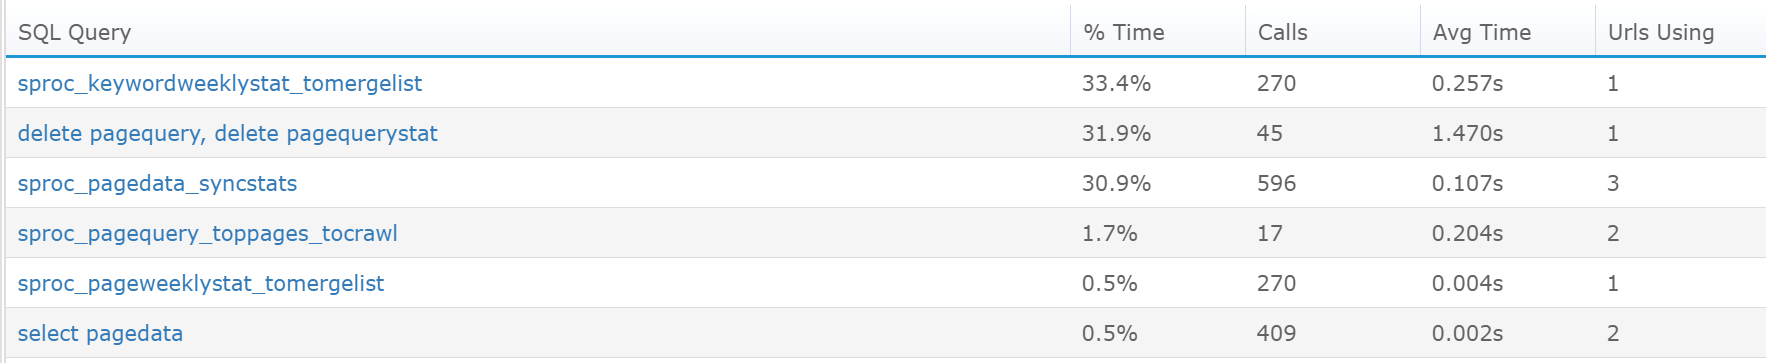
Retrace automatically tracks every SQL query executed by your code. This includes stored procedures, dynamic SQL, crazy looking Entity Framework queries and more. Quickly identify which queries are being executed, how long they take, and how often they are being called.
Since Retrace works via lightweight .NET code profiling, it also has the ability to collect all exceptions being thrown by your code. This includes all first chance exceptions being thrown by your code, unhandled exceptions, or just exceptions being logged to your logging frameworks.
Retrace provides powerful error monitoring and log management features. You can send all of your logging to Retrace via NLog, log4net, Serilog, and others. With Retrace, you can search across all of your logs from one place and do many other advanced log management features.
Retrace automatically tracks the CPU and memory usage of your Windows Service. You can also use it to track many other standard Windows Performance Counters. Including stats around garbage collection and exceptions be thrown per second. Retrace can also monitor custom Performance Counters created by your applications.
Custom metrics are also supported by using the StackifyLib NuGet packages. With just a couple lines of code, you can track how often or long it takes your Windows Service to do virtually anything.
Learn More: When & How to Use Custom Application Metrics
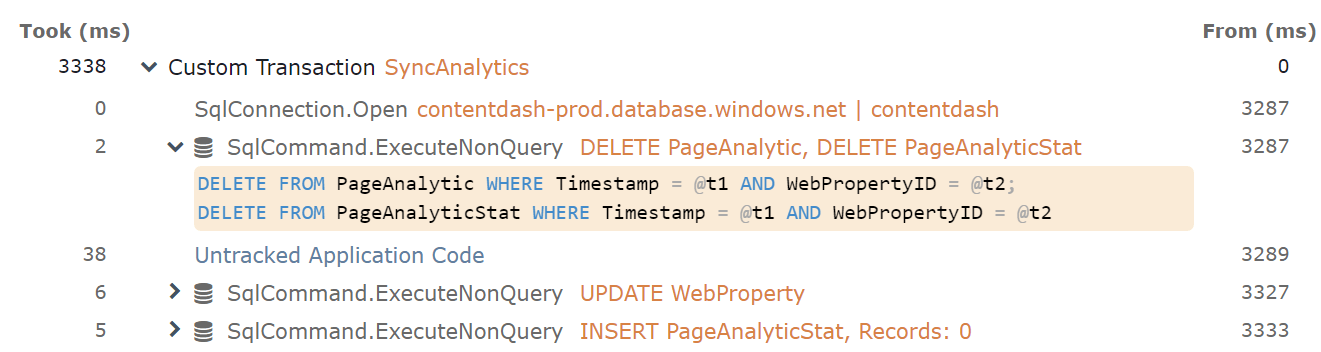
One of the most powerful features of Retrace is the code level snapshots that it collects. For any of the operations being tracked for your Windows Service, you can view all of the key methods, dependencies being called, exceptions, logs, and much more in context.
Example trace from a Windows Service:
There are many differences between Retrace and Application Insights. The most important one in regards to Windows Services is that Application Insights doesn’t really support Windows Services out of the box. It requires manually coding everything in your application that you want to send it.
With Retrace, all you have to do is define the operations within your code and all application dependencies, exceptions, and logs are then tracked within those defined operations. Retrace just works.
Application Insights requires that you manually report to them every single dependency call. This means every single place you do a SQL Database, web service call, or similar dependency usage, you would have to modify your code to report it. Sounds like fun, right?
Retrace is an excellent choice for Windows Services, Azure WebJobs, or Azure Worker Roles.
Developers heavily depend on Windows Services to get a lot of mission-critical work done. Monitoring Windows Services is critical to making sure that they are working correctly and performing well.
Retrace is an excellent solution for monitoring the performance of your Windows Services. Retrace works with all ASP.NET, .NET Core, and .NET applications. Retrace also works for Azure WebJobs and Azure Functions.
Note: Retrace also supports “self hosted” ASP.NET applications running in a Windows Service. Including WCF and Web API web applications.
To learn more, check out our product page about Retrace and our overview of application monitoring.
Stackify's APM tools are used by thousands of .NET, Java, PHP, Node.js, Python, & Ruby developers all over the world.
Explore Retrace's product features to learn more.


