
Elasticsearch is a distributed search server based on Lucene and it can be used to search a wide range of documents. It is written in Java and runs as a service with a RESTful web API. Elasticsearch is the second most popular enterprise search engine
At Stackify, we use Elasticsearch for Errors, Logs and APM data. Thus, it was essential for us to understand how it performs and how it affects the overall application performance and user satisfaction.
Stackify’s solution provides you with few simple steps with the following abilities:
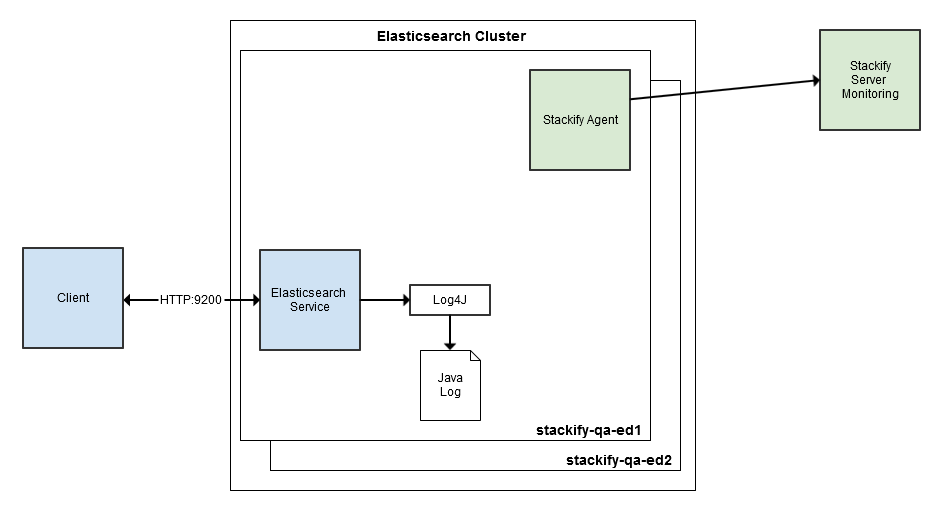
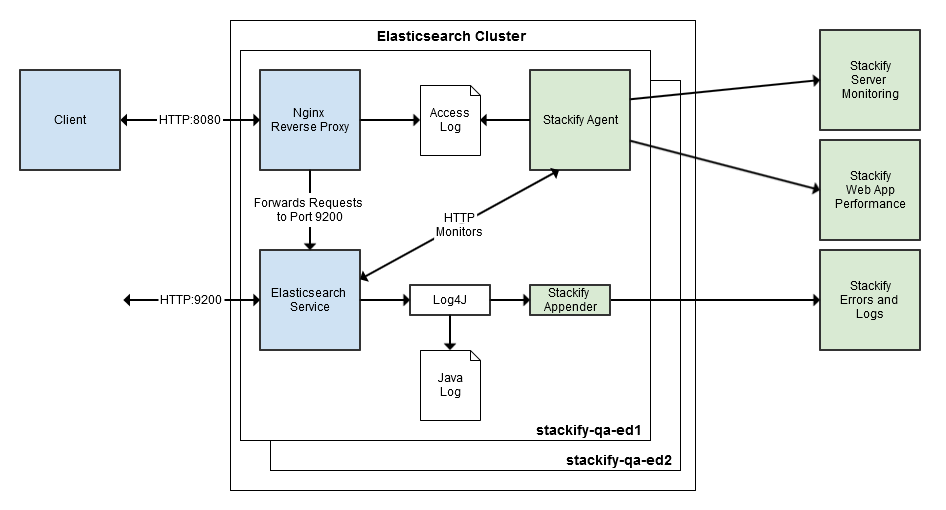
In this post, we will show you how we monitor our own Elasticsearch clusters and how you can do the same.
One of the core solutions offered by Stackify is application performance monitoring. By installing the Stackify agent on all servers in your Elasticsearch cluster, you can immediately gain insight into some core server metrics.
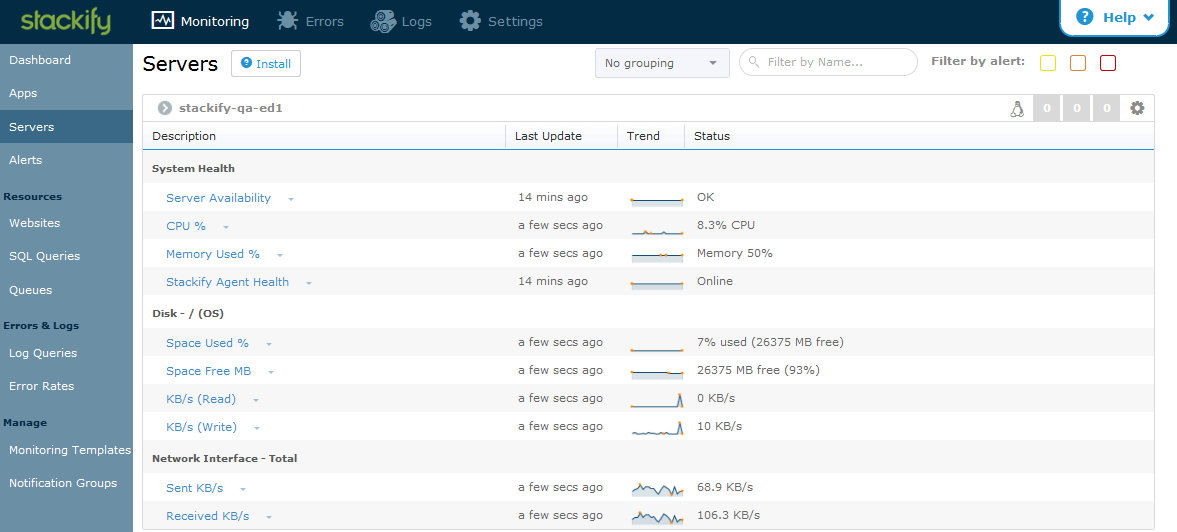
Installing the Stackify agent is as simple as downloading the installer package, uncompressing the installer, and running a shell script. Out of the box, you will see that we have monitors for server availability, CPU, memory, disk space, and network adapters.
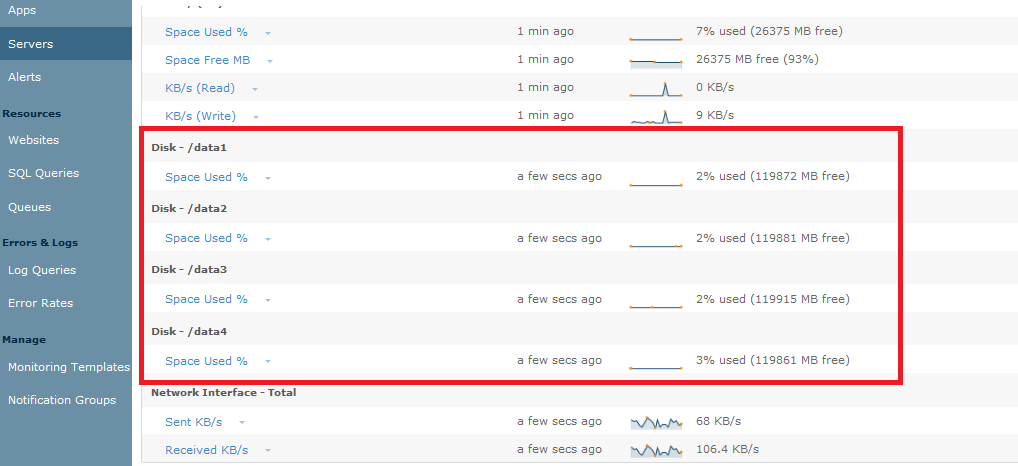
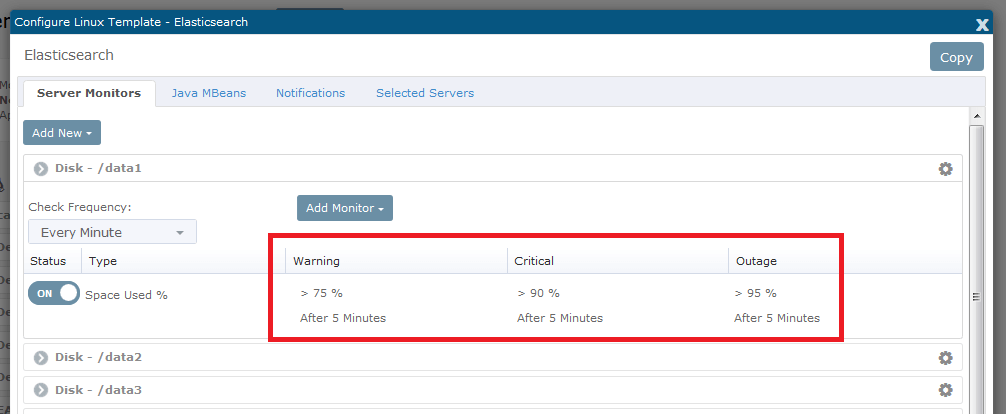
For our cluster, we also have Elasticsearch data disks (/data1, /data2, /data3, /data4) that we wanted to monitor. It is a very simple change to the server template and add disk space monitors for all other disks.
Within only few moments, we started gathering data for server availability, CPU, memory, network, and disk space. All of these monitors are also capable of generating notifications. For example, we can set up email or SMS alerts when disk space use is above a certain percentage.
Next, we’ve added specific monitors around the Elasticsearch service. In Stackify’s app dashboard, enable Elasticsearch service monitoring. This is under Monitoring / Apps / System V Service / elasticsearch. Doing so, you now have a dashboard aggregating data for alerts, server CPU, and memory, and Elasticsearch service CPU and memory for all instances of Elasticsearch in our cluster.
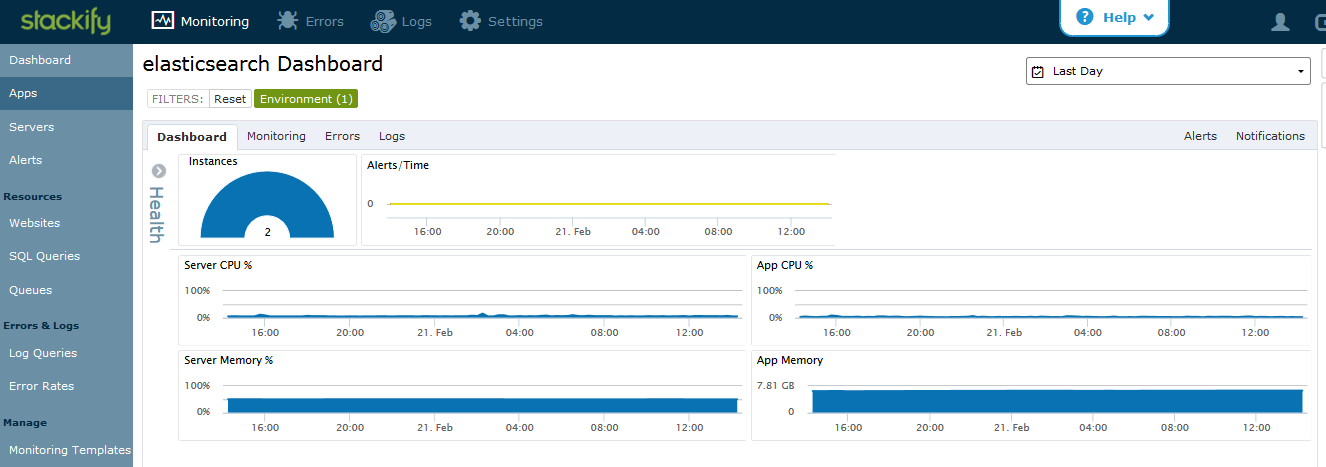
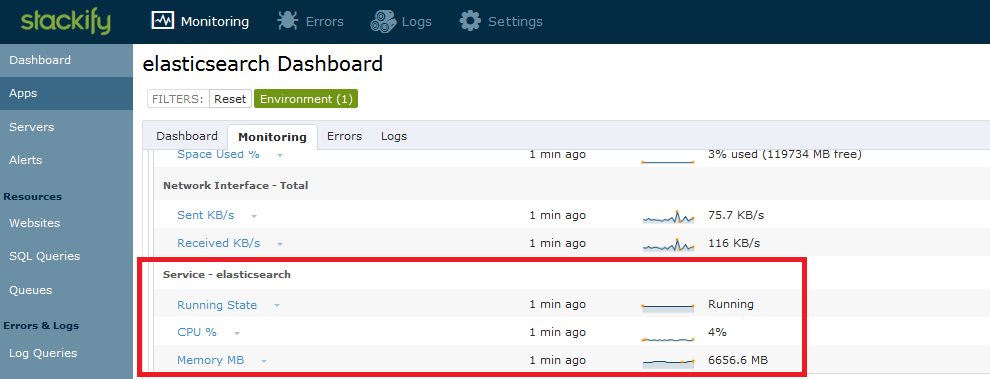
The monitoring section within the dashboard includes all the server monitors that were previously added and an additional group of monitors about the Elasticsearch service. Stackify automatically adds monitors for the service status, CPU, and memory of each server.
Elasticsearch comes with a wide variety of node level and cluster level REST APIs. Some examples include cluster health, cluster stats, and node stats. Stackify can monitor these endpoints and associate them to the Elasticsearch application. The results of these monitors will roll into the overall view of the Elasticsearch service.

First, let’s set up a cluster health monitor. Here is the REST API that we are interested in.
$ curl http://localhost:9200/_cluster/health?pretty=true
{
 "cluster_name" : "stackify-qa-es",
 "status" : "green",
 "timed_out" : false,
 "number_of_nodes" : 2,
 "number_of_data_nodes" : 2,
 "active_primary_shards" : 14,
 "active_shards" : 28,
 "relocating_shards" : 0,
 "initializing_shards" : 0,
 "unassigned_shards" : 0
}
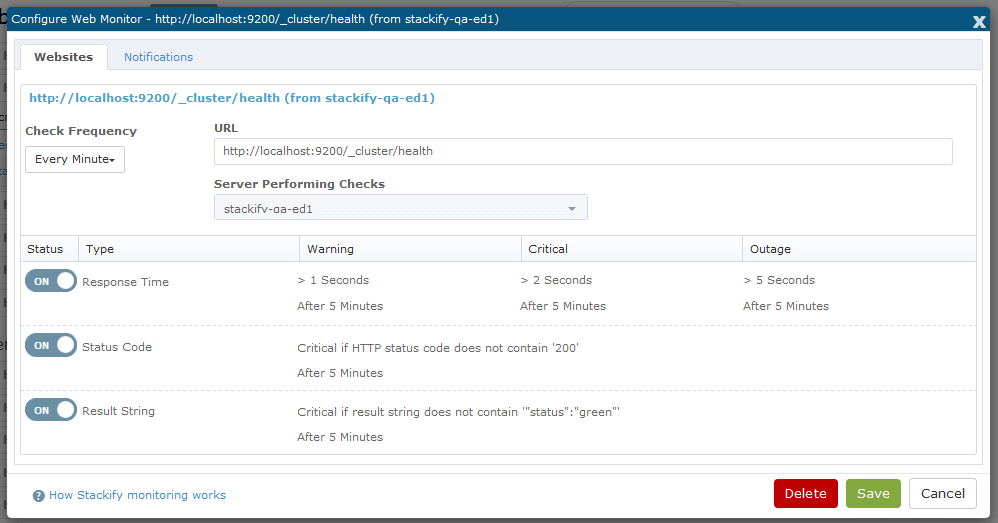
We will then add a monitor in Stackify that will alert us if the cluster health is yellow or red for at least five minutes. In addition to checking the JSON result of the cluster health, we will also make sure response times are appropriate and that we are always getting a HTTP OK status.
Here is the internal website monitor setup in Stackify.
Let’s set up one more monitor around JVM heap used percentage on each server. This seems to be an early indicator of memory problems. Here is the REST API:
$ curl http://localhost:9200/_nodes/stackify-qa-ed1/stats/jvm?pretty=true
{
  "cluster_name" : "stackify-qa-es",
  "nodes" : {
    "muhLtBYLTDKMAcwLg8yYlQ" : {
...
    "jvm" : {
      "timestamp" : 1424552267936,
      "uptime_in_millis" : 1316338992,
      "mem" : {
         "heap_used_in_bytes" : 4412726920,
         "heap_used_percent" : 58,
         "heap_committed_in_bytes" : 7498760192,
...
}
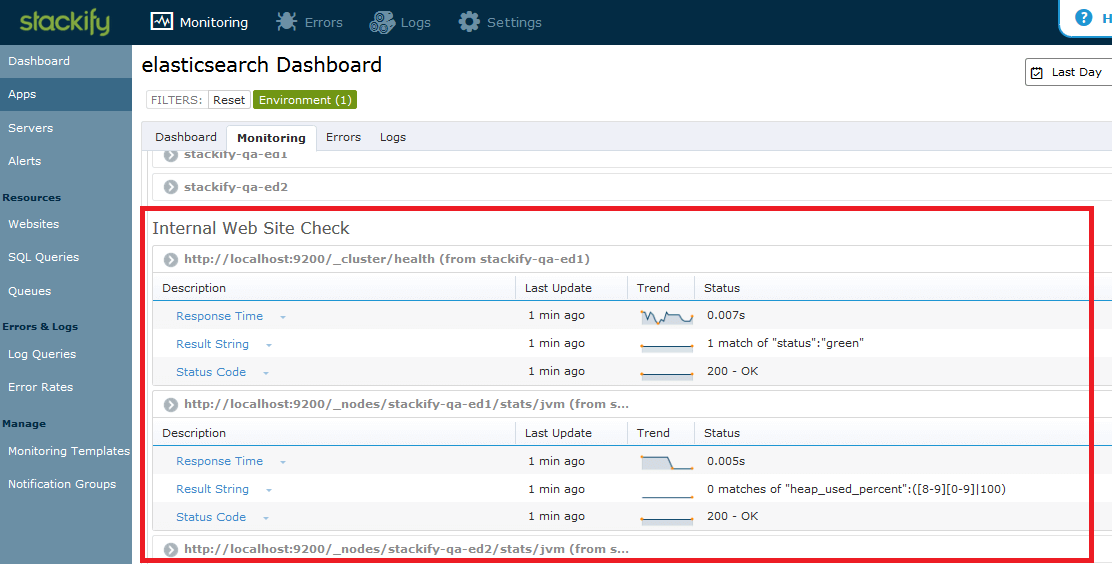
We would like to monitor if heap_used_percent is > 80%. We can evaluate the result of the REST API using a regex expression.

Now, you will see the HTTP monitors as additional monitors in the Elasticsearch service dashboard.
Elasticsearch uses Apache’s log4j library for all java application logs. These are typically in /var/log/elasticsearch/*. You can use Stackify to view or tail these log files. A better approach is to send the logs directly to Stackify using our log4j appender.
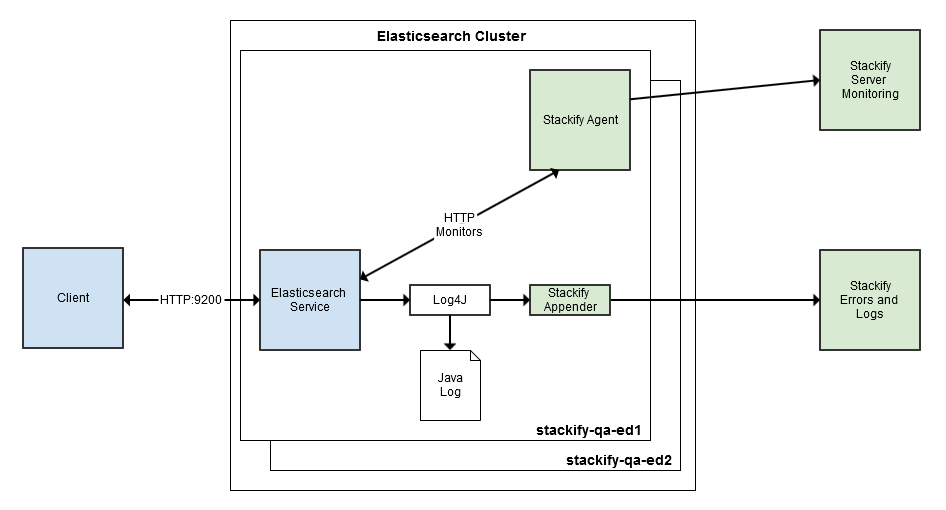
Elasticsearch has a YAML abstraction around the log4j configuration, but all of the log4j settings can still be customized. You can add the Stackify Log4j Appender to Elasticsearch service and start sending detailed errors and logs to Stackify.
First, add the stackify-log-log4j JAR (and its dependencies) to a directory on Elasticsearch’s classpath.
Here are the JARs that you need:
http://mvnrepository.com/artifact/com.stackify/stackify-log-log4j12/1.1.5
http://mvnrepository.com/artifact/com.stackify/stackify-api-java/2.1.4
http://mvnrepository.com/artifact/com.fasterxml.jackson.core/jackson-annotations/2.1.2
http://mvnrepository.com/artifact/com.fasterxml.jackson.core/jackson-core/2.1.3
Next, you’ll need to make two changes to Elasticsearch’s logging.yml configuration file. You will define the stackify appender and add it to the root logger. You can get YOUR_API_KEY from the main Settings page in Stackify.
...
rootLogger: ${es.logger.level}, console, file, stackify
...
appender:
...
 stackify:
   type: com.stackify.log.log4j12.StackifyLogAppender
   apiKey: YOUR_API_KEY
   application: elasticsearch
Now, restart the Elasticsearch service for the logging changes to take effect.
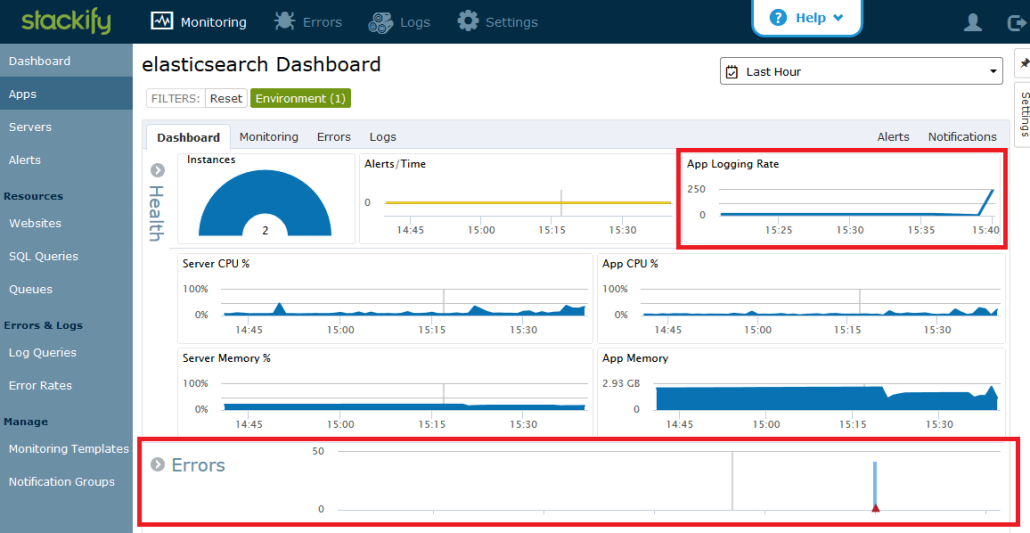
Once logs are flowing in to Stackify, you will notice a few additional charts on the Elasticsearch service dashboard. Stackify automatically adds a graph for the logging rate and the error rate.
In the monitoring section, it will add a set of monitors that track the error rate of Elasticsearch.
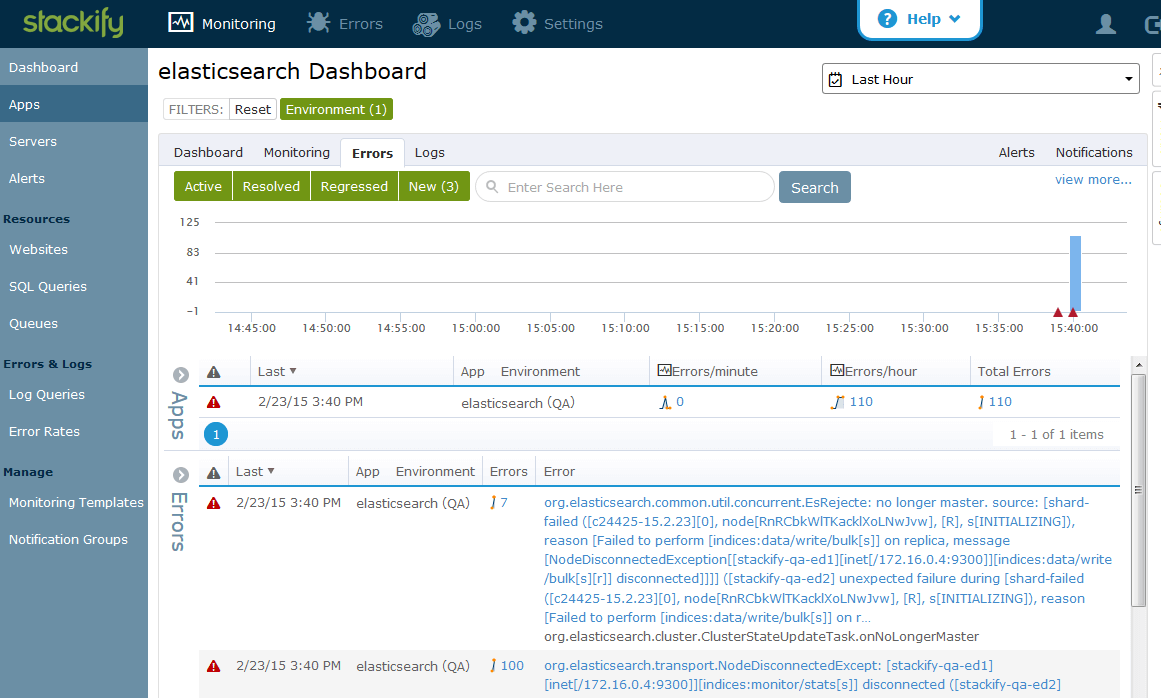
The Errors section contains detailed information about the errors.
The Logs tab contains all messages logged by Elasticsearch.
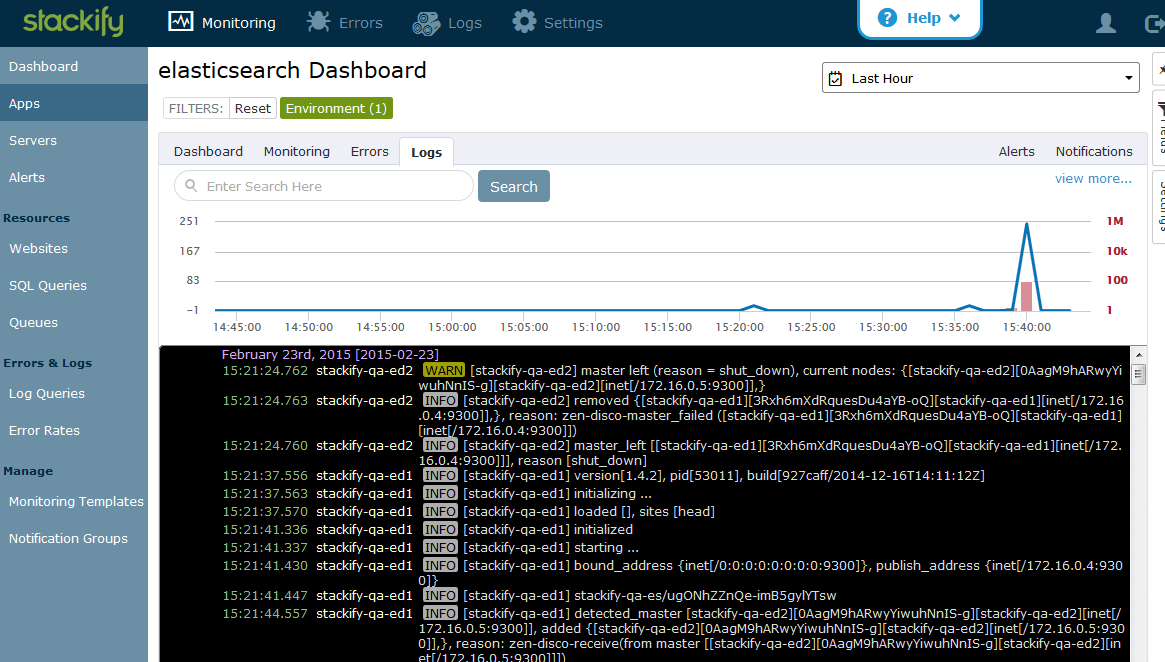
We now have all java logs from the Elasticsearch service posted back to Stackify. We can see an aggregate view of all logs and errors for all nodes in the cluster interleaved and sorted by timestamp.
Elasticsearch has a very complete HTTP REST API, but HTTP access logs (like you would get with Apache or Nginx) aren’t available. With access logs, Stackify can collect and aggregate very detailed performance data about all of the HTTP requests that are being sent to Elasticsearch. Without knowing your HTTP error rate or requests per minute, you are really flying blind. Fortunately, installing Nginx as a reverse proxy to Elasticsearch is a very simple process.
After installing Nginx (sudo apt-get install nginx), edit the configuration file (/etc/nginx/sites-enabled/default) to set up the reverse proxy.
server {
   server_name stackify-qa-es;
   listen 8080;
   root /var/www/nginx;
   location / {
      proxy_pass http://localhost:9200;
      proxy_http_version 1.1;
      proxy_set_header Connection "Keep-Alive";
      proxy_set_header Proxy-Connection "Keep-Alive";
   }
   access_log /var/log/nginx/stackify-qa-es-access.log stackify;
   error_log /var/log/nginx/stackify-qa-es-error.log;

}
Also edit the main nginx configuration file (/etc/nginx/nginx.conf) to add the access log format for stackify to the existing http section.
http {
   ...
   log_format stackify '$remote_addr $msec "$request" $request_time $status "$http_user_agent"';
   ...
}
After this change, restart Nginx to apply the changes.
Next, you need to make a few changes to access log file permissions so that the Stackify agent can process them.
sudo chmod 755 /var/log/nginx
sudo chmod 644 /var/log/nginx/*.log
After installation is complete, route all client requests to Nginx (different port number). This will give us Nginx access logs which Stackify can collect.
You will now see a new new Nginx application (stackify-qa-es) in the App Dashboard. Similar to the Elasticsearch dashboard, this gives you aggregated information of all nginx services running the stackify-qa-es application, both aggregated server monitors, and service monitors for nginx service.
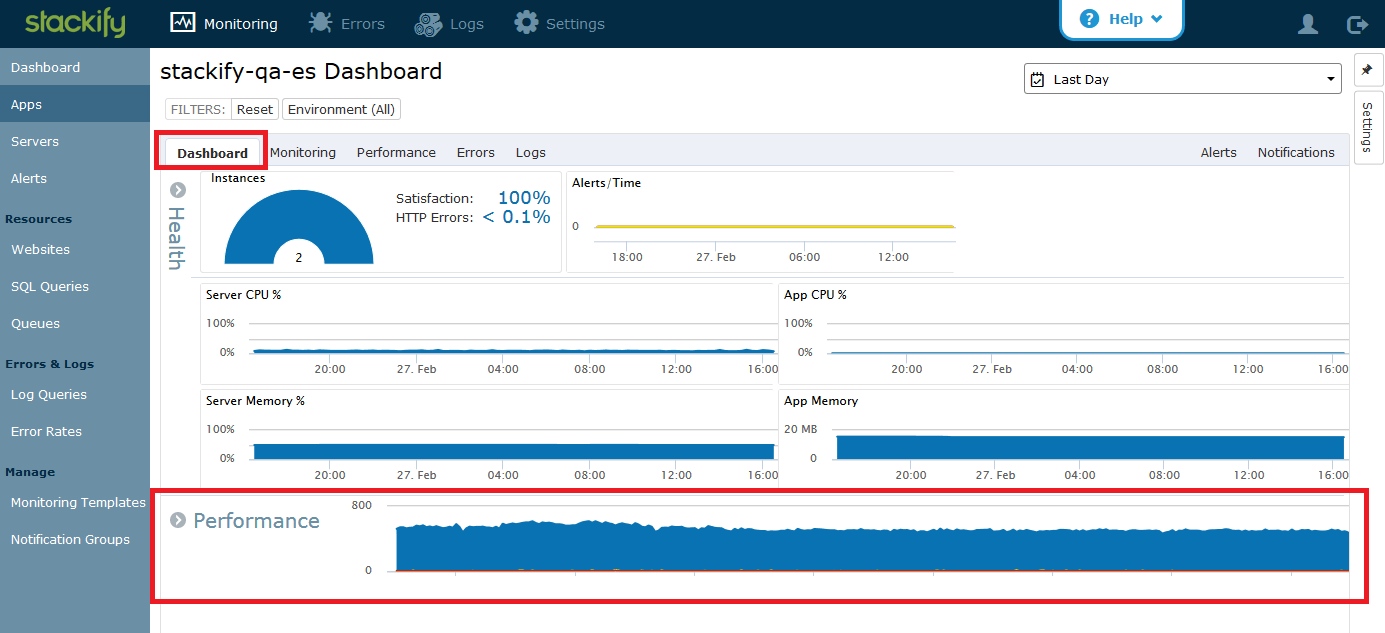
The Performance section is where you can start seeing information that the agent is collecting for all of the HTTP requests. On the dashboard, you can see a color-coded graph of requests by user satisfaction (based on Apdex score). If you expand the band, you can see more details.
Go to the monitoring tab, and you will see a new section of aggregate web performance monitors.
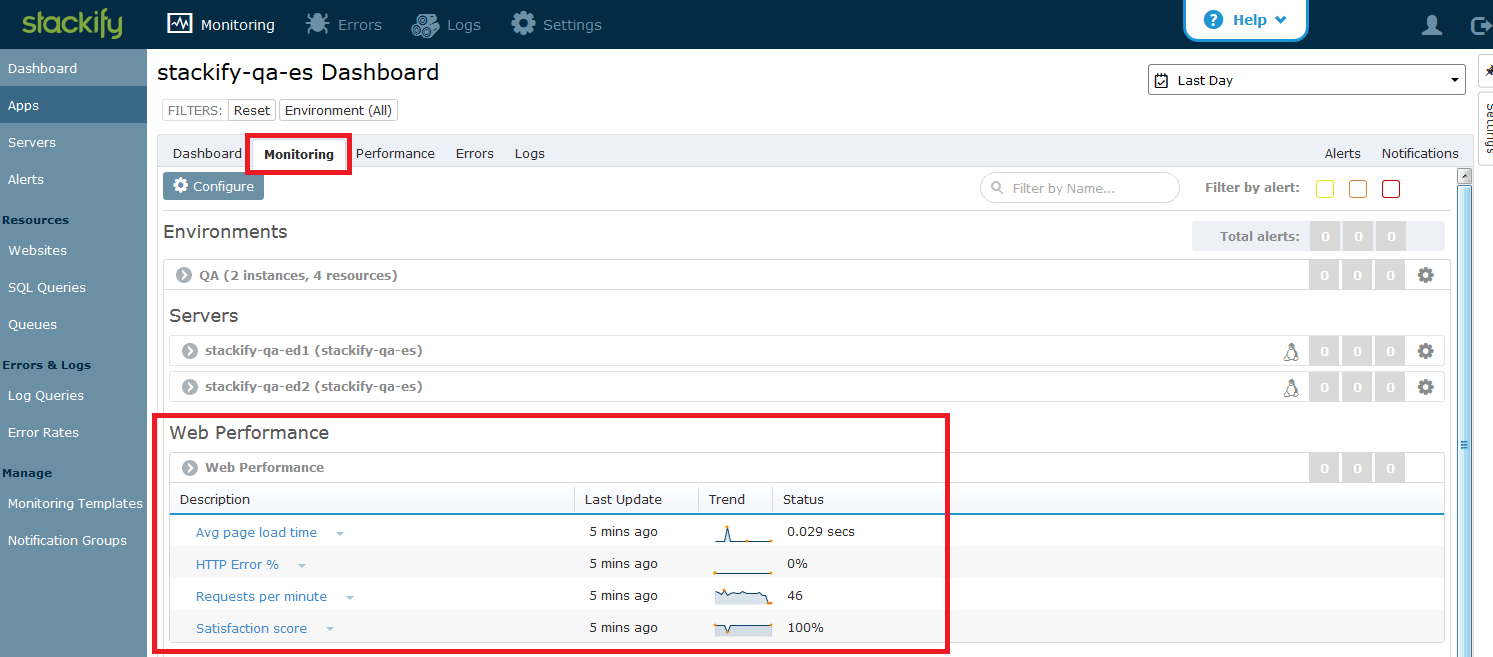
Here, you can see stats like requests per minute, HTTP error rate, and user satisfaction score. Just like all other monitors, these stats are capable of generating notifications. Want to get emails when the HTTP error rate goes over 5%? Want a text when requests per minute is zero? Just set them up and get notifications as issues are starting to trend in the wrong direction.
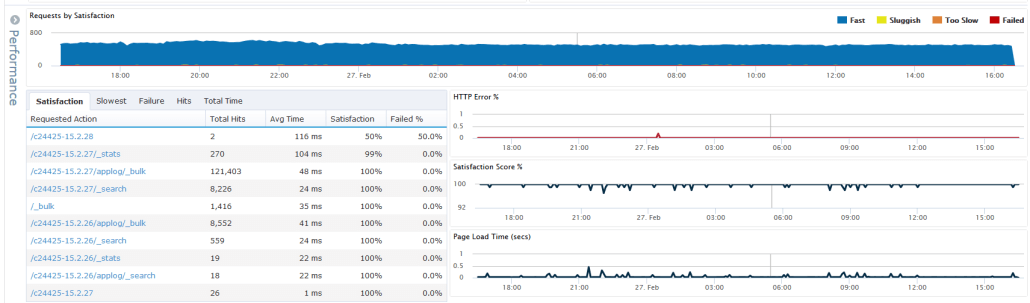
The Performance tab contains also more details about the HTTP requests.
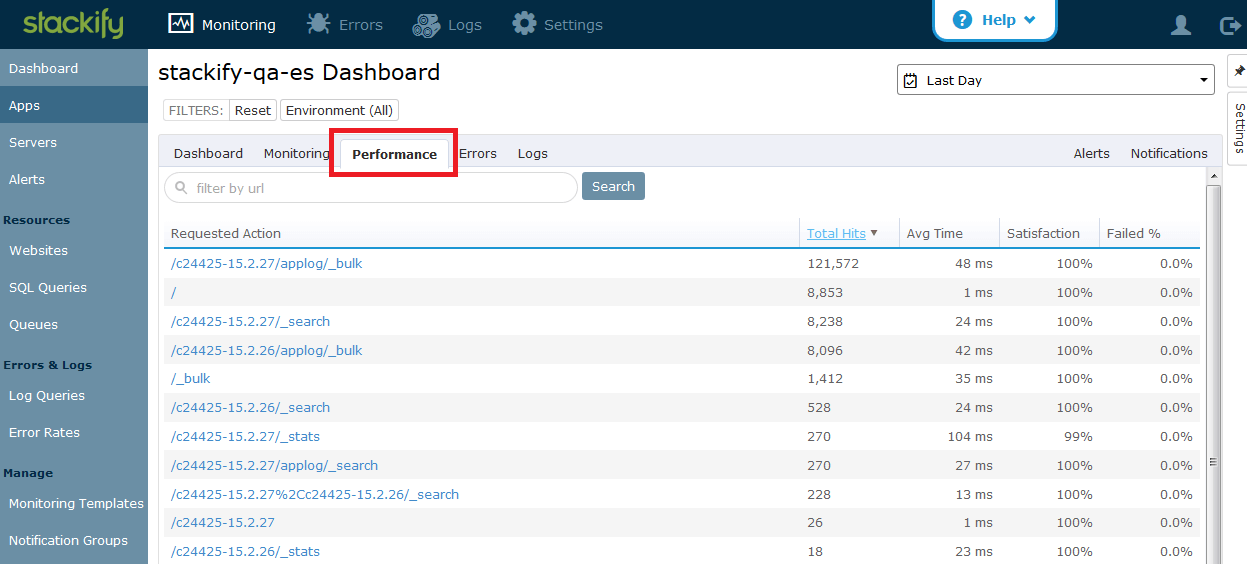
This gives us more detailed information about each unique URL. You can see the number of requests to each URL in the given time frame along with average time, user satisfaction and HTTP error rate.
Stackify provides a wide range of application and server monitoring that can be applied to Elasticsearch clusters. After installing the agent, we were able to monitor key server metrics suck and cpu, memory and disk space. After configuring the log4j appender, we were able to see an aggregate view of all logs and errors in the Elasticsearch cluster. Once the nginx reverse proxy was added, we have detailed information about all web requests that are sent to Elasticsearch. With these in place, we have been able to get a much better view of the system and monitor key health and performance metrics.
Stackify Linux Installation: https://support.stackify.com/hc/en-us/articles/205419575-Installation-for-Linux
Stackify Server Templates: https://support.stackify.com/hc/en-us/articles/204719899-Server-Monitoring-Templates
Elasticsearch Cluster Health API:
http://www.elasticsearch.org/guide/en/elasticsearch/reference/current/cluster-health.html
Elasticsearch Node Stats API:
http://www.elasticsearch.org/guide/en/elasticsearch/reference/current/cluster-nodes-stats.html
Stackify Errors and Logs Overview:
https://support.stackify.com/hc/en-us/articles/205419435-Errors-and-Logs-Overview
stackify-log-log4j on GitHub:
https://github.com/stackify/stackify-log-log4j12
Elasticsearch: Playing HTTP Tricks with Nginx: http://www.elasticsearch.org/blog/playing-http-tricks-nginx/
Stackify Configuration for Nginx: https://support.stackify.com/hc/en-us/articles/205419835-Configure-for-Nginx
Stackify's APM tools are used by thousands of .NET, Java, PHP, Node.js, Python, & Ruby developers all over the world.
Explore Retrace's product features to learn more.


