
Anyone developing software will sooner or later want to debug their code. It’s very clarifying to see your code execute step by step and inspect the values of variables at runtime. Developing with PHP is no different. In this article, we’ll have a look at PHP debugging, and I’ll also provide some tips and tricks.
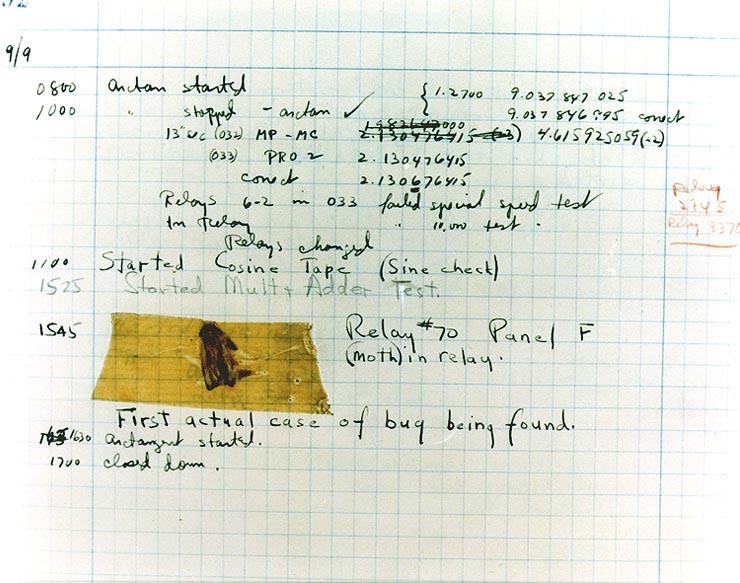
The term “bug” was first used by Thomas Edison, but was popularized by the celebrated Grace Hopper in 1947 when an actual moth was physically removed from a relay in the Mark II computer at Harvard. They even taped it to the log.
Today, we define debugging as running the application while inspecting the existing variables and seeing the instructions that are currently run. This means the application waits for the developer to give the command before proceeding to the next statement. Usually, this happens in an editor or IDE. We call this interactive debugging.
Non-interactive debugging occurs when log statements are added to the code and inspected after the application has run. This is a crude way of debugging, but not necessarily a bad idea. For example, multi-threaded applications are notoriously hard to debug in an interactive way. Using a log to identify which thread did what is actually very helpful.
As a starting point, we’ll take this simple PHP file:
<!DOCTYPE html>
<html>
<body>
    <form action="index.php" method="post">
        <p>Your name: <input type="text" name="name" /></p>
        <p>Your age: <input type="text" name="age" /></p>
        <p><input type="submit" /></p>
    </form>
    <p>
        Hi <?php echo $_POST ? htmlspecialchars($_POST['name']) :  'anonymous'; ?>
    </p>

    <p>
    <?php
    function getMessage($age) {
        if ($age < 60) {
            return 'You are '. (int)$_POST['age'] . ' years old.';
        } else {
            return 'You are of a respectable age.';
        }
    }

    if ($_POST) {
        $message = getMessage($_POST['age']);
        echo $message;
    }
    ?>
    </p>
</body>
</html>
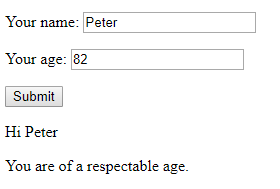
This renders a simple form that, when posted, produces the following result (I entered the posted values again for clarity):
Let’s start with the most simple form of (non-interactive) PHP debugging: writing output somewhere so we can read it later. The easiest way to do this in PHP is to write to the document that PHP renders. In our example, we could simply add something like this to the code:
<!-- Posted:
<?php
    if ($_POST) {
        echo var_dump($_POST);
    }
?>
-->
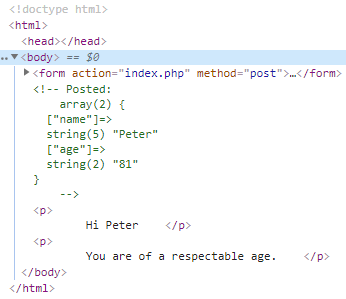
Notice how we wrapped our PHP code in an HTML comment. This allows the page to look the same as before. However, in the underlying source, we can now see the result of the “var_dump” call. This is what it looks like in my browser’s developer tools:
Of course, this info is still sent to the client, which isn’t ideal. You could potentially be exposing too much information about your application to people with bad intentions.
There are variations to this technique. For example, there are tools that will write certain information to the browser’s console instead of the HTML output, but they all involve sending data over to the client.
Another disadvantage is the need to write statements prior to running the application. For example, if we forget to “var_dump” a variable, we need to change the code and run the application again.
Before we continue with PHP debugging, I want to take a look at our development environment. PHP uses a php.ini file to control its behavior. When you install PHP, it usually comes with a php.ini-development and a php.ini-production file. On your local machine, or on a development server, you can safely rename php.ini-development to php.ini. This configuration will expose more information than you would want in a production environment. However, it’s useful information when you’re developing. On the production server, you’ll want to use the php.ini-production file.
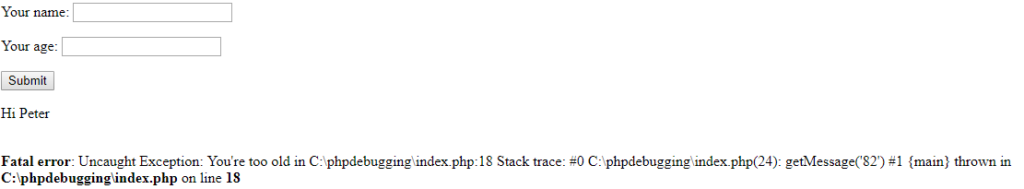
One such setting is the “display_errors” directive. This means that any exceptions that are thrown during the execution of your application will be rendered to the user. For example, if we throw an exception in our “getMessage” function, we’ll see something like this:
Another interesting setting is the “error_reporting” directive. In development, it’s set to “E_ALL,” meaning PHP will report anything out of the ordinary. This includes best practices and coding standards. In a production environment, these checks would slow down your application too much. That’s why the production version of php.ini will exclude some errors.
If your changes don’t seem to have any effect, restart your web server. It doesn’t seem necessary when you’re running PHP on IIS on Windows, but your experience may be different.
It’s important to have a php.ini for development purposes and one for production servers. By splitting the configuration, we have access to useful information, while not exposing this to the outside world. Now let’s continue debugging.
Xdebug is a PHP debugging tool that’s been around for quite a while. There are alternatives, but Xdebug seems to be very popular, is actively maintained, and has good documentation. Because PHP runs on different platforms, I recommend using the Xdebug wizard to know which version to install and how. Once it’s installed, we can start using it.
It’s interesting to read the documentation on Xdebug about stack traces. You can configure it to render quite a lot of useful information when things go wrong. For example, this is what I’ve added to my php.ini file to configure Xdebug:
xdebug.collect_params=4 ;show full information about parameters passed to functions
xdebug.show_local_vars=on ;show any variables in local scope
xdebug.dump.SERVER=REQUEST_URI,DOCUMENT_ROOT,SCRIPT_FILENAME ;show these server variables
xdebug.default_enable=1 ;enable Xdebug
Our error now shows a lot more information that we can use to pinpoint the problem.
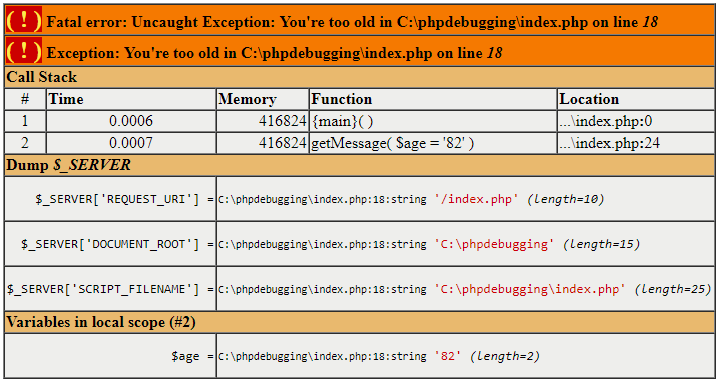
We can now see the call stack, local variable, server variables, and what we passed to our function.
Now that we’ve set up non-interactive debugging, let’s look at interactive debugging. This is also called remote debugging.
Xdebug allows debugging clients to connect to it by using the DBGp protocol. This isn’t really important to us, except that it allows you to use almost any IDE or editor, as long as it (or a plugin) supports this protocol. Most major editors should be able to debug PHP with Xdebug. Check out the overview on Xdebug’s website for a list of supported clients. But even if you don’t see your favorite editor, it might still be possible. For example, Visual Studio Code isn’t mentioned, but there’s a PHP Debugging extension available.
To allow remote debugging, we need to add these two lines to our php.ini file:
xdebug.remote_enable=1 ;enable remote debugging
xdebug.remote_autostart=1 ;autostart, so we don't have to make a special HTTP request first
It’s very likely that you’ll have to configure your editor before it can connect to Xdebug. Check your editor’s documentation to see how.
If you’ve used the settings mentioned above, the editor will have to connect to the default port 9000. You can then interactively debug in your editor. For example, this is me debugging our application in Visual Studio Code:
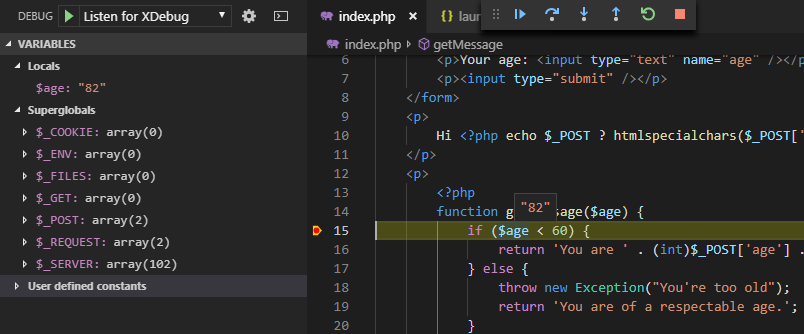
We can now stop on breakpoints to inspect local and global variables, proceed through our application step by step, and even modify variables. In the screenshot above, I’m hovering my mouse over the “$age” variable and we can see its value.
Xdebug will connect to our editor for each request that we make. As long as our editor is listening for Xdebug, we can debug each and every request.
This is a much more powerful way of debugging than writing messages to the HTML we’re rendering.
Now that we have the basics covered on how to debug PHP, let’s take a look at some tips and tricks. We’ve actually already covered three:
Now for some extras.
Sometimes, it can be useful to see the full trace of a request without using the remote debugger. For example, there might be a time when you want an overview of all the calls made so you can analyze it later. Xdebug allows us to create function traces by adding these settings to php.ini:
xdebug.auto_trace=1 ;immediately start tracing
xdebug.trace_output_dir=C:\PHP72\traces ;where to write the traces (must exist!)
For simplicity’s sake, I’ve set “auto_trace” to “1” so that Xdebug starts tracing all our requests immediately. This is useful if you want traces of any code in your auto_prepend_file.
Tracing everything is easy, but it can lead to a lot of trace files if we tell Xdebug to create a new file for every request, as we’ll see later. If you don’t want to trace every request, remove the “auto_trace” setting and add this:
xdebug.trace_enable_trigger=1 ;allow triggering traces
xdebug.trace_enable_trigger_value="secret" ;only if this secret is provided
With this, a call to “index.php” won’t trigger Xdebug to write a trace. But a call to “index.php?XDEBUG_TRACE=secret” will. You can also provide this in a cookie. This might seem like a clumsy way of doing things. Luckily, there are browser extensions to help you. For example, Xdebug helper for Chrome provides a simple button to help you switch tracing on or off.
One final interesting setting is “trace_output_name.” With our current configuration, Xdebug will always overwrite the same file. That’s why we can add this setting:
xdebug.trace_output_name=trace.%u
Xdebug will now create a new file with the timestamp in the filename.
For this example, I’ve artificially made our application a bit more complex to render a trace that looks like this:
TRACE START [2019-03-21 10:42:02]
0.4024 419112 -> {main}() C:\phpdebugging\index.php:0
0.4024 419112 -> htmlspecialchars('Peter') C:\phpdebugging\index.php:10
0.4025 419112 -> level1() C:\phpdebugging\index.php:41
0.4025 419112 -> level2() C:\phpdebugging\index.php:24
0.4025 419112 -> level3() C:\phpdebugging\index.php:28
0.4026 419112 -> level3b() C:\phpdebugging\index.php:29
0.4026 419112 -> getMessage($age = '8') C:\phpdebugging\index.php:42
0.4027 333064
TRACE END [2019-03-21 10:42:02]
This is a simple example, but traces can quickly become very large. Here’s a screenshot of only part of a Drupal trace for example:
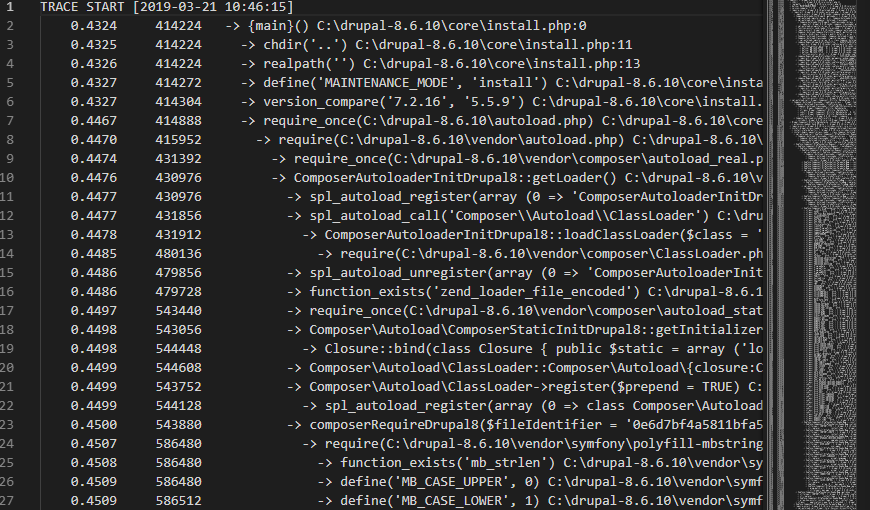
The first column shows the time since the tracing started, in milliseconds. The second column shows the memory usage at that point in time.
If you add “xdebug.show_mem_delta” to your php.ini file, you’ll get an extra column showing you the difference in memory consumption. This is useful if you’re trying to find a function that uses too much memory.
There’s also “xdebug.collect_return,” which will add the return value of each function to the trace.
Finally, the “xdebug.collect_params” setting influences the tracing output too. It determines how much information is displayed regarding the parameters that were passed to functions. This setting also influences the Xdebug profiler, which we’ll see next.
Profiling is similar to, but slightly different from tracing. It does the same as tracing, but it stores the information in a file that certain applications can open to show you a useful overview. It also provides a way of seeing how many times a function was called and how long the function takes to execute relevant to the overall request.
To enable profiling in Xdebug, you can add settings that are similar to the tracing settings.
xdebug.profiler_enable=1
xdebug.profiler_output_dir=C:\PHP72\profiler ;make sure this directory exists!
xdebug.profiler_output_name=profile.%u
Profiling can also be configured to work with the GET/POST parameter or cookie, just like tracing. And you can use the browser extensions here too.
I made our application a bit more complex again by adding some artificially slow functions. After making my request, there’s a new file in the directory I specified. There are several tools that can open a PHP profiling file. Have a look at the Xdebug documentation. I opened our profile file in PHPStorm:
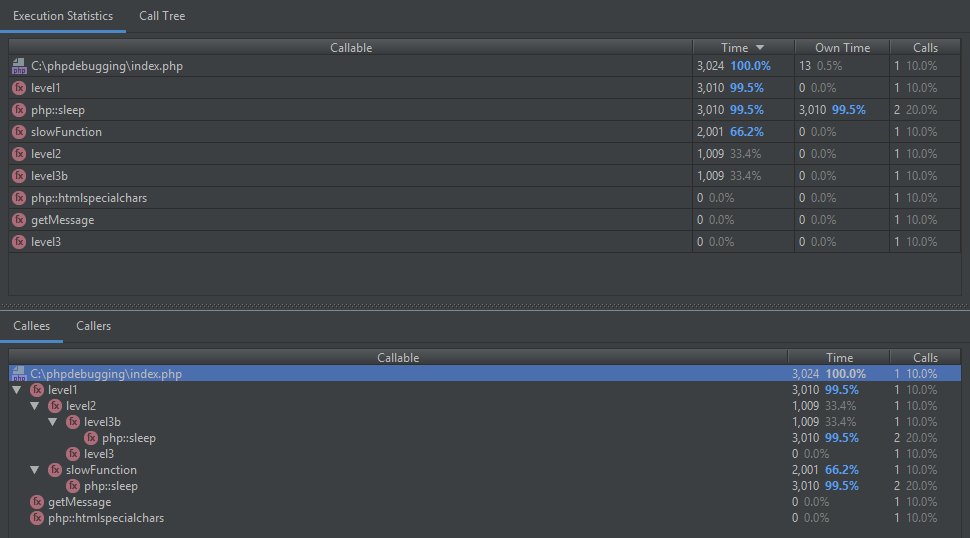
Again, this is a simple example. But in a real application, it can give you useful insights.
In the above overview, you can see
For each statistic, you can see the absolute value and the percentage relevant to the entire profiling session.
Profiling and tracing allow us to debug performance problems. The application might work perfectly otherwise, but finding the cause of a performance problem is also part of debugging.
When you need to debug an issue that happened in production, your safest bet is to reproduce it in a unit test. This allows you to consistently and continuously run in on your local machine, fix the issue, and be sure the issue remains fixed.
Unfortunately, this isn’t always possible. Sometimes, we have no idea how the issue occurred. Or it might be a combination of things happening in your application that you can’t reproduce easily. In any case, you could use a better view of your production environment.
One option is to install Xdebug on your production server. Only allow it to kick in when we provide a request parameter or cookie with the correct value. Be sure to keep this value secret!
However, Xdebug will have an effect on performance and even worse, might open your application to a malicious attack. This is where monitoring comes into play. A modern APM solution will monitor your running application. That way, you have access to the necessary information after the issue surfaced. Retrace supports PHP monitoring, including things like
You can then use this information as a starting point to improve your code and fix bugs on your local machine.
This post has given you several techniques on how to debug PHP applications. We’ve briefly touched on non-interactive debugging, but this is a simple way of debugging. A better way is to go the interactive route and use Xdebug. It gives us remote debugging with step-by-step execution of your code and variable inspection. There are also very useful tracing and profiling functions. Just be sure to do this on your development machine, not in production.
Bugs will always be part of any software. But with these PHP debugging tips, you’ll be able to understand and fix your applications faster and more easily.
Stackify's APM tools are used by thousands of .NET, Java, PHP, Node.js, Python, & Ruby developers all over the world.
Explore Retrace's product features to learn more.


