Over the span of two decades, a lot of information was made available online to unearth the full potential of PHP. It is one of the most popular programming languages in the world, and some say it’s one of the easiest to learn. Still, even the best languages need some help. Help can be found in the many PHP tools available in its large ecosystem. A PHP profiler is considered the most valuable.
In general, profilers benefit developers of all levels. They used it to find bugs and fix performance issues. However, a programmer’s mindshare is quite limited, as to the classifications of profilers.
Hence, in this article, we will be talking about the three primary PHP profiler types, each with its own unique set of advantages and disadvantages.
We will then go through each type of PHP profiler and share some examples of profilers that cater to PHP. Also, its pros and cons are presented as a guide for the developers.
A standard method and line-level profiler is the most common type of PHP profiler, but also the type you might use the least. In other words, everyone has used a standard profiler, but you might only pull it out a few times a year.
If you’re having a major problem with your application, standard profilers can help you get to the bottom of it. Standard profilers periodically record stack traces of their application. These samples give you a snapshot of important metrics like CPU, memory usage, time spent per line of code, and frequency of method calls.
PHP has two significant profilers that belong to the standard type: Xdebug and Xhprof.
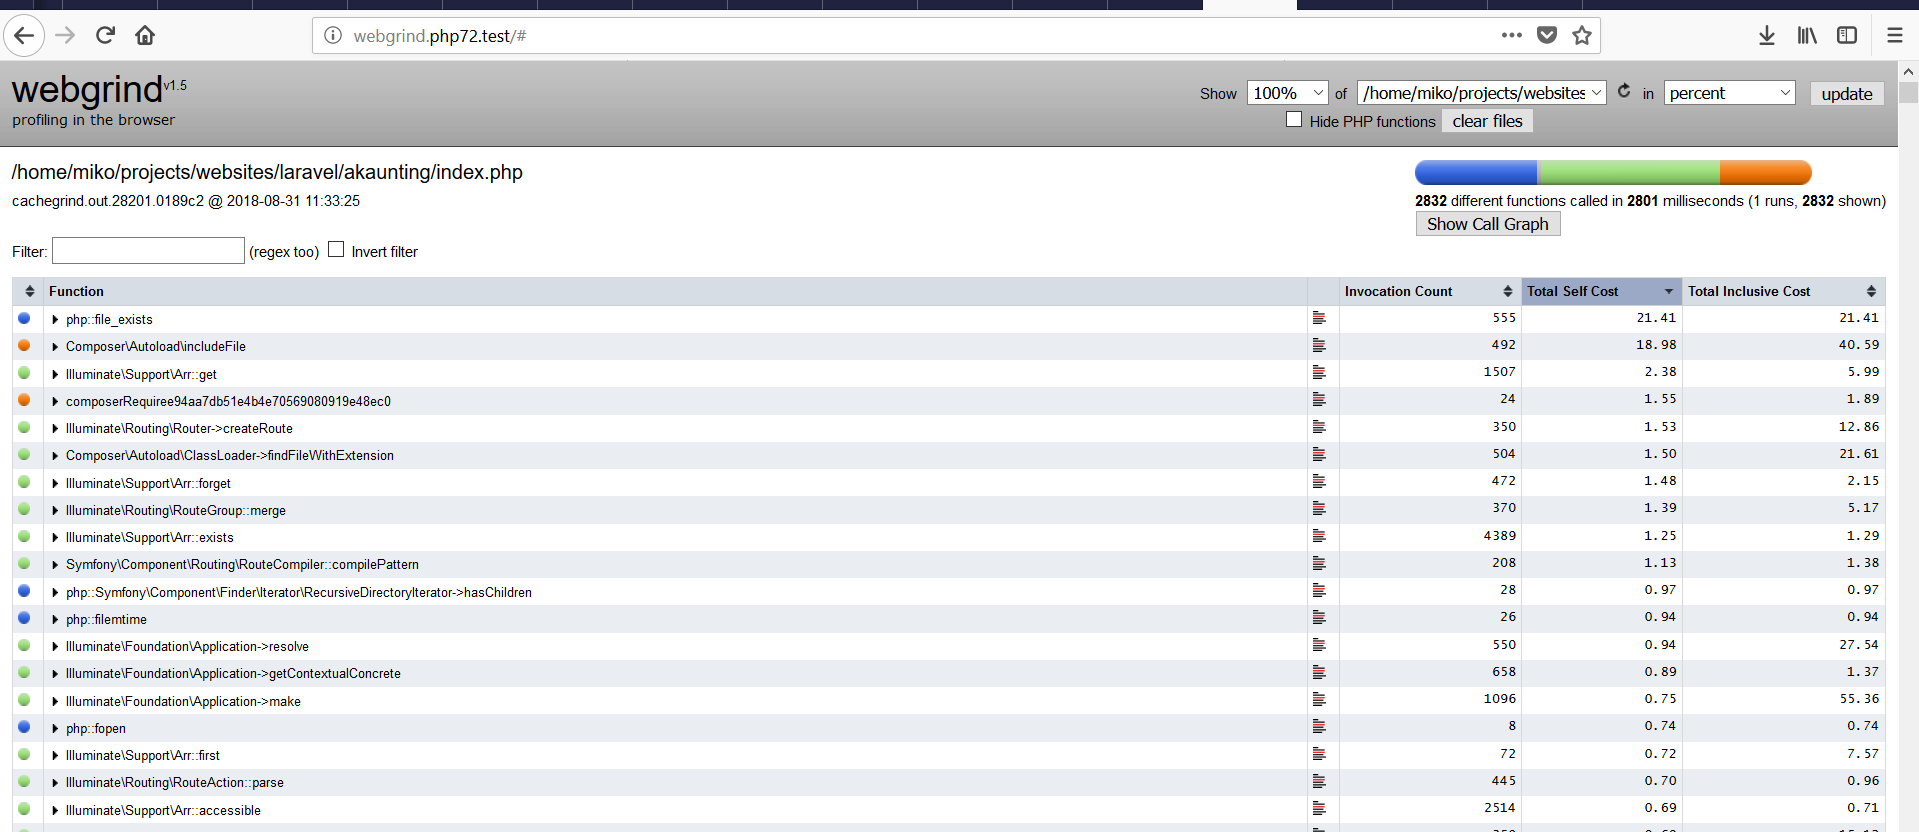
Xdebug is easy to install and operate, and it does not require code changes. This powerful PHP profiler was released in 2002. Since then, it has an unprecedented growth and remains popular among PHP developers. Its major features include stack and function tracing, code coverage analysis, remote debugging, and scripts profiling. As this article suggests, we will focus on its profiling feature. It provides the developer the detailed information about the script performance, helps identify which parts of the code are slow. Then, collected information is being stored in cachegrind compatible file and can be analyzed using one of the external tools, such as KCachegrind, WinCacheGrind, xdebugtoolkit, or the web-based analyzer Webgrind as shown below.
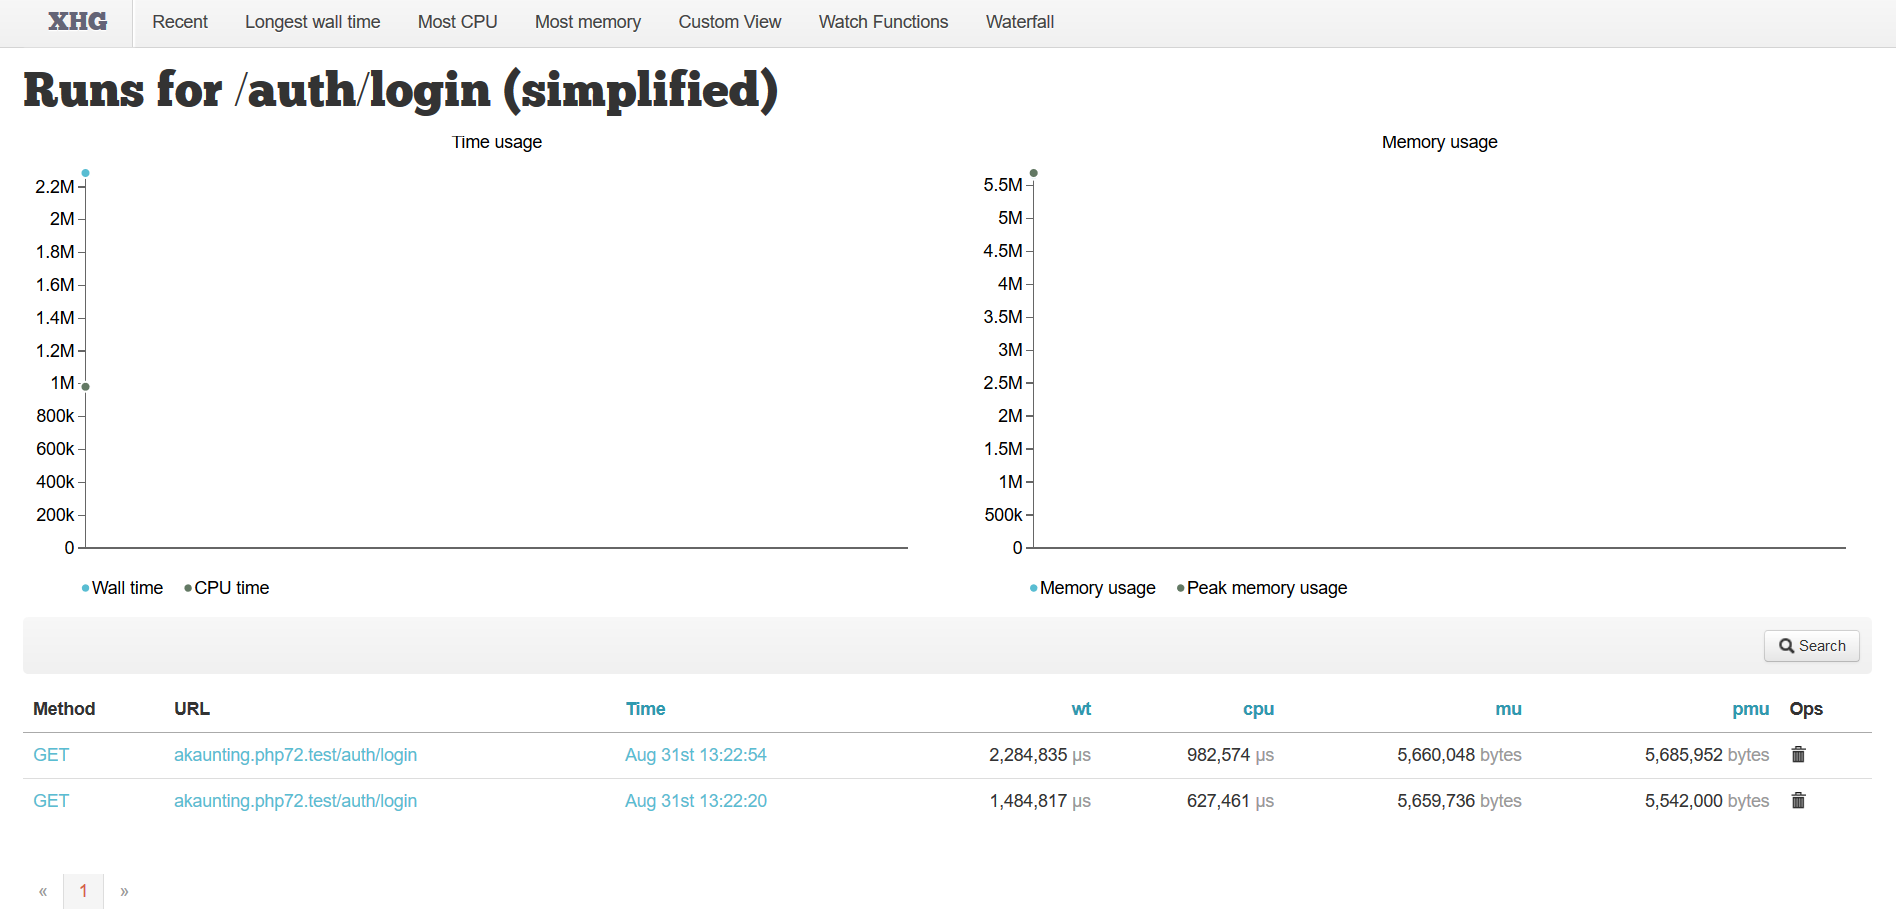
Xhprof was created by Facebook and includes a basic UI for reviewing PHP profiler data. It aims to have a minimum impact on execution times and require relatively little space to store a trace. Thus, you can run it live without a noticeable impact on users and without exhausting the memory. For full functionality, Paul Reinheimer has created Xhgui, an enhanced UI project for reviewing, comparing and analyzing profile data as shown below.
 Pros
Pros
Cons
Tracing profilers are lighter weight than standard profilers and can be used while you code. Unlike standard profilers, you can use tracing profilers everyday, and it won’t slow you down. These are designed to catch errors in real time while you’re developing, instead of catching errors after the fact. You can think of tracing profilers as your first line of defense in your war on bugs.
There are two robust PHP profilers that belong to the tracing type: Z-Ray and Prefix.
To win the war on bugs, Z-Ray is another tool to look into that is very significant in the PHP developer’s toolkit. It has PHP debug capabilities that are unlike anything you’ve ever seen before. It displays all the internal details of a page request, across all the PHP scripts involved in building the page. It is injected into the response coming from your PHP app. Also, it is shown right in the browser that you are using for development. The good thing is that you get vastly greater insight without changing your development workflow.
Prefix from Stackify is a free lightweight PHP profiler for developers. It caters .NET and Java with PHP coming soon. It allows getting some detail from your server-based profiling. It runs on the desktop and gives details about what their code is doing while creating or testing their apps. It is the world’s best log viewer for developers. For example, with each ASP.NET web request, you can see all your log statements plus many other details.
Pros
Cons
APM tools monitor your entire web stack throughout the development lifecycle. They give you basic server metrics like CPU and memory, as well as detailed, code-level insights on your application’s performance. Some APM tools also give you transaction tracing and logging metrics as well.
Unlike a standard or tracing PHP profiler, APMs do more than just identify code errors. They help you find inefficiencies and areas for improvement across your entire web stack. They are a crucial part of any PHP project.
There are two robust PHP profilers that belong to the APM type: Retrace and New Relic
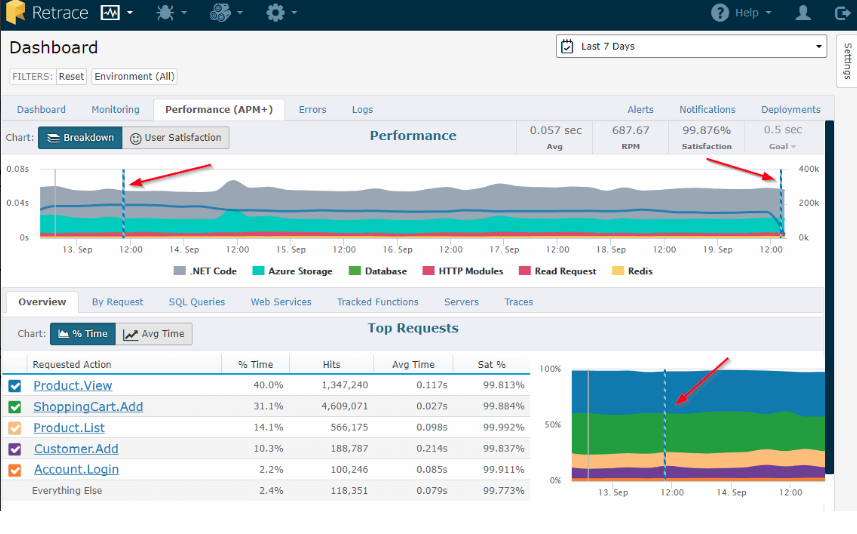
To know more about Retrace, here is an article that compares the major difference between Retrace from New Relic. A screenshot of Retrace is shown below.
Pros
Cons
Each of the 3 PHP profiler types plays a unique role during development. Standard profilers are best for big performance issues like high CPU or memory usage. However, standard profilers are resource-heavy and time-intensive. These are not meant for everyday use.
Tracing profilers, on the other hand, are perfect for everyday use because it is lightweight and can be used in conjunction with development. This is a PHP developer’s best friend because tracing profilers give you a second set of eyes on your code. But due to their small footprint, tracing profilers aren’t very powerful.
Application performance monitoring tools provide the most comprehensive picture of your application’s health. APMs help you identify the slowest parts of your stack and drill down to the code-level to fix them.
Developers need all three profilers to be successful. Each one is a great tool concerning different circumstances. If utilized together, each PHP profiler helps developers catch errors in real time, fix major computing issues, and monitor the health of their application day after day.
Stackify's APM tools are used by thousands of .NET, Java, PHP, Node.js, Python, & Ruby developers all over the world.
Explore Retrace's product features to learn more.


