Real User Monitoring, also known as End User Monitoring or RUM, is a way of monitoring the client side portions of an application. Real User Monitoring for JavaScript allows developers to have access to key metrics for load times and user paths being used in production as part of their application performance management (APM).
Retrace is an APM tool from Stackify that already monitors the server side requests of an application and now includes the Real User Monitoring data alongside the insightful server side monitoring Stackify is known for.
To keep customers happy and google rankings high, Real User Monitoring for JavaScript is important for identifying problem areas that negatively affect the user experience. Constant monitoring of applications allows insight into when and on which pages load times increase and timeouts occur.
Real User Monitoring also helps pinpoint issues that were not identified in staging due to the restrictions of pre-production testing and different platforms used in production. With the RUM data collected, developers can proactively address and prioritize solutions to slow running JavaScript and keep users happy.
Real User Monitoring for JavaScript collects key metrics like load times, errors, and platform incompatibility. Page specific monitoring allows for developers and product managers to see where and when there are slow load times for JavaScript elements that negatively impact the customers and where improvements can be made to enrich the user experience.
For example, when an image is too large it can slow the time it takes for a page to load. The image can be identified as the problem when using a monitoring tool like Retrace that can show a breakdown of the elements being loaded and how long each one takes. With those details, it is easy to identify that the image is taking up the majority of the load time and needs to be edited. Below is a closer look into how Retrace can be utilized to monitor JavaScript and improve user experience.
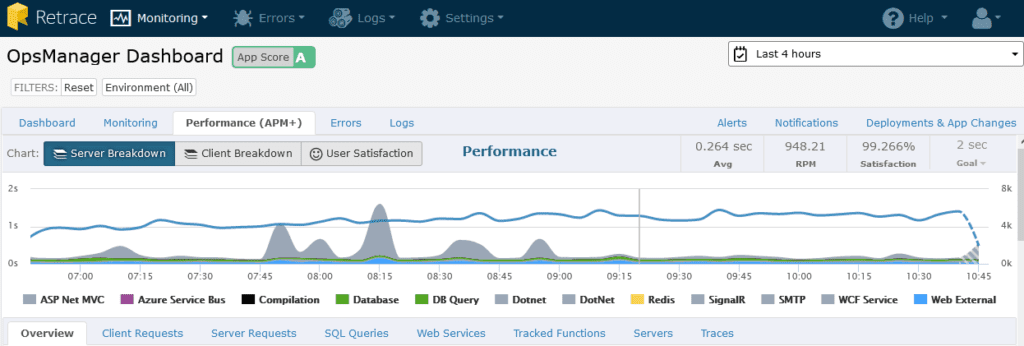
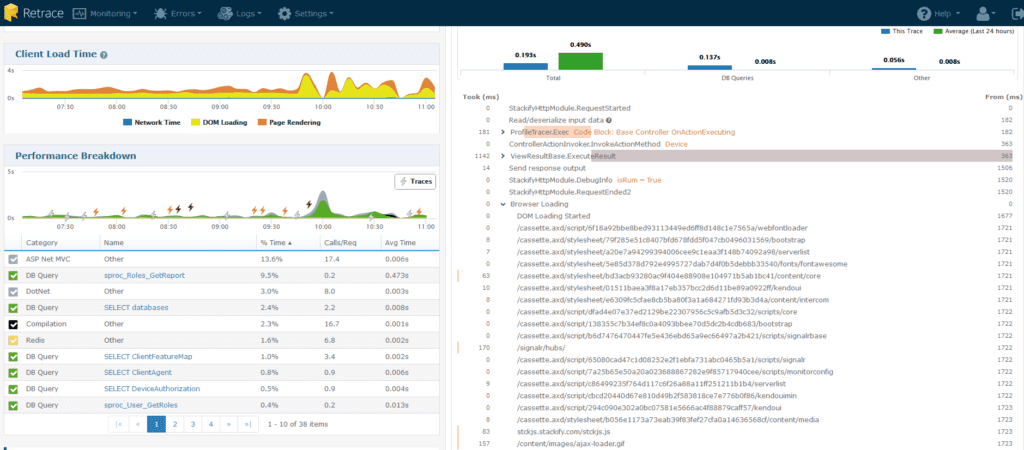
With Retrace, Real User Monitoring for JavaScript is made easy. Within an application’s dashboard, the Performance graph and request list can be filtered to focus on the client side information. The graph shows the Server Time, Network Time, DOM Loading, and Page Rendering elements in a color coded breakdown for the time period being viewed.
This offers quick insight into how long it takes a page to load and the fluctuations that can happen based on the amount of traffic at different times of day or how performance changed after a deployment.
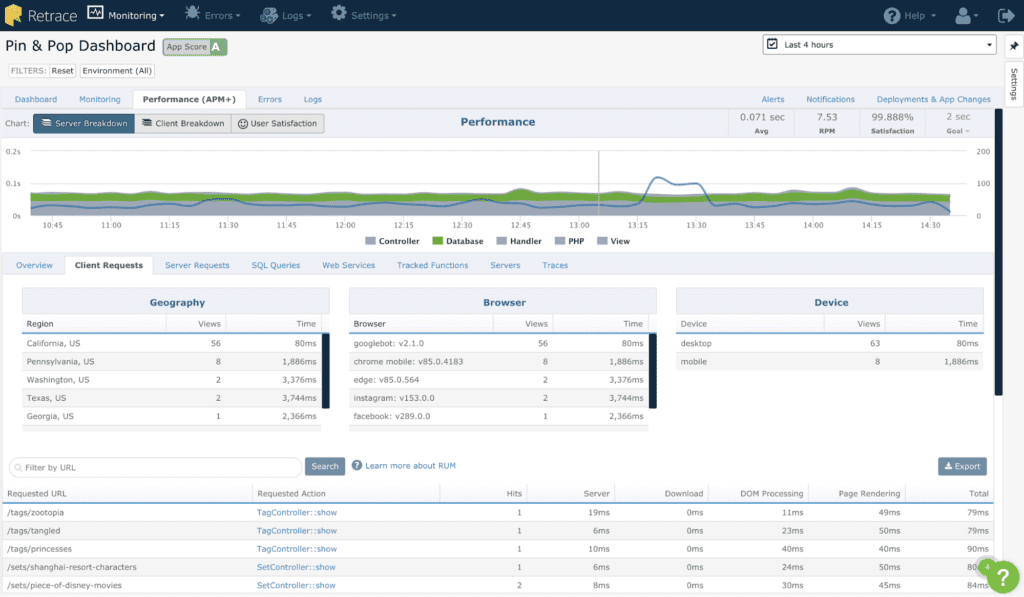
Below the graph, there is a tab specific for Client Requests where the actions within the specified time period are listed with a quick glimpse of information in the datatable for number of hits, download, DOM processing and page rendering times.
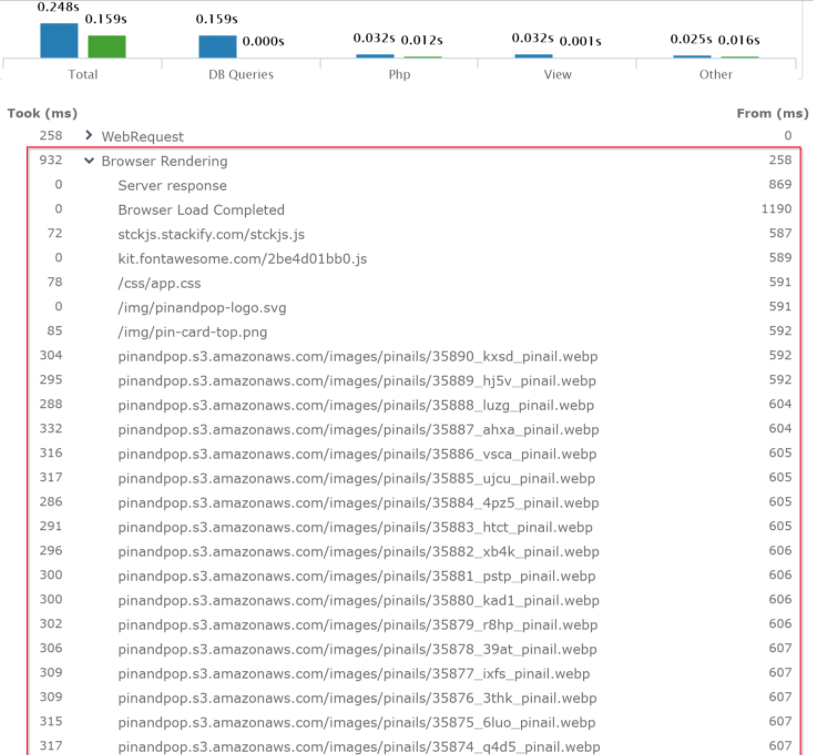
Unique to Retrace is how the performance information is displayed and integrated tightly together. On the right side of the screen is the Trace breakdown for the request, including the server side details. This unique trait ensures that you have a full look into what was happening for the request on both the front end and back end without having to match up the request and time in different views.
The client information is found under the Browser Loading section of the breakdown and shows the elements loaded from the moment the DOM loading starts. On the left of the list are the times each element took in milliseconds that help identify where optimizations can be made and what potential bottlenecks there are, like an image that is too large.
To enable RUM for Retrace, a script is generated in the account as outlined here. This script is then included in the head tag on any HTML page that is to be monitored. To see the data in Retrace, the Stackify Agent must also be installed on the servers hosting the application.
Details on Agent installation can be found here. Once configured, Retrace gives full insight into the requests of an application and can be used in both production and non-production environments.
Real User Monitoring for JavaScript with Retrace makes it easy to monitor your application and ensure user satisfaction. Using tools like Retrace allow for visual monitoring of the details of an application’s performance on both the server and client sides of requests.
Retrace also allows for configuring monitors and alerts to help be proactive with issues discovered in an application before too many users are affected. Retrace users can enable RUM for their applications here. If you do not already have an account, start a trial today and see how Retrace can help you improve the full life cycle of your applications.
Stackify's APM tools are used by thousands of .NET, Java, PHP, Node.js, Python, & Ruby developers all over the world.
Explore Retrace's product features to learn more.


