What’s New in Retrace: Java on Windows Support Now Available
By: Alexandra
| March 20, 2018

We are happy to announce the release of Java on Windows in Retrace! This latest Retrace release aims to provide first-class support for monitoring Java web applications and services running on Windows systems. Now all the Java APM features that you could use on Linux are now also available for Windows!
In addition, the release supports the most commonly used application servers and frameworks in the Java ecosystem.
Let’s briefly recap some of the features you’ll get with Retrace:
- Application performance statistics and alerts
- Method call stacks
- Database queries
- Tracking requests
- Monitoring of errors and logs
Setting up the Windows Agent
To get started, you’ll have to download and install the Retrace Agent on your Windows machine.
You can use this for basic server profiling or full-fledged APM monitoring.
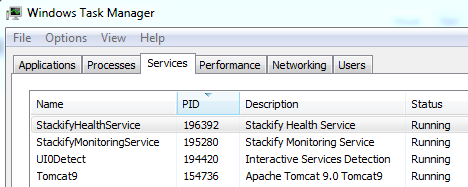
To check that the Stackify Service is running, you can look in the Task Manager at the list of services:

Now you’ll be able to find the Windows Server on the Console‘s “Servers” page:

This shows the type of server and whether APM is enabled.
Then, for each server, you can view high-level statistics on the CPU, memory and storage status:

Furthermore, detailed statistics on these metrics, as well as processes and applications are also available.
Supported Java Application Servers
Once the agent is installed, you can configure it for the application servers you’re using. Retrace can easily be enabled for the most popular application servers – including Tomcat, Jetty, JBoss, and Wildfly.
Let’s have a look at a quick example of configuring the agent for a Tomcat server. All you need to do is add it to the catalina.bat file:
"set CATALINA_OPTS=%CATALINA_OPTS% -javaagent:"[APM JAR LOCATION]"
This adds the javaagent JVM parameter to the existing list of JMV options, pointing to the location of the Retrace APM jar.
Restart Tomcat and that is all. Now you can monitor this server and any applications running on it in the Stackify Retrace Console.
Let’s see one more example of a JBoss AS installation. In the standalone.conf.bat file, you simply add the line:
set "JAVA_OPTS=%JAVA_OPTS% -javaagent:[APM JAR LOCATION]
Unsurprisingly, the process is fairly similar for all application server types; you just need to add the javaagent parameter to the specific configuration file.
Supported Java Frameworks
Retrace contains out-of-the-box support for a large number of popular Java frameworks and libraries designed, from popular web MVC frameworks to web services and data storage.
If these frameworks are part of your application, the console will show metrics for them by default.
Let’s have a look at some of the popular ones supported in Retrace, to get a better idea of what insights the tool can provide.
First, the agent monitors applications built most web frameworks – including Spring, Apache Struts, and Play. To be more specific, the Spring support includes both Spring 4 and the more recent Spring 5, the previously mentioned Spring Boot, as well as Spring Batch.
What’s more, there is also support for Thymeleaf, which is quite often used in the presentation layer for Spring applications.
Of course, no web monitoring tool would be complete without support for the old faithful servlet. The monitoring console will provide statistics for requests that use the Servlet API as well as the JEE 8 Servlet 4 API. The view technologies typically used with servlets, namely JSP and JSF are also monitored.
Here’s an example that shows a high-level overview of all the requests monitored in a Spring web application and their performance:

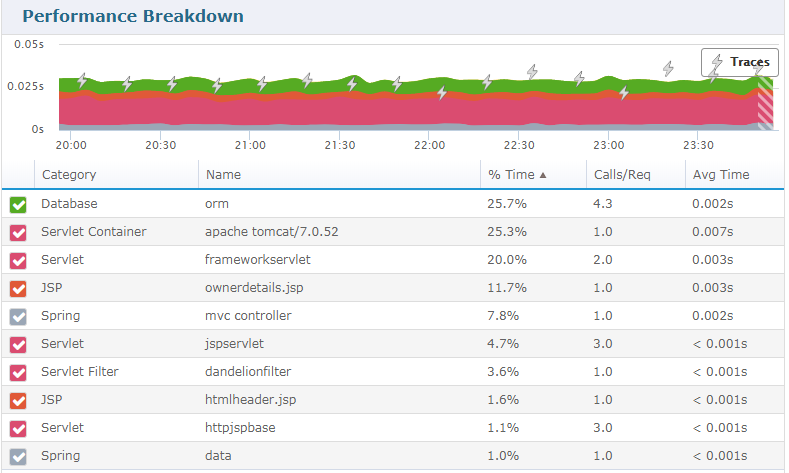
For each request, you can find a detailed trace and performance breakdown:

This trace will show all the actions performed during the request, from database queries, to the MVC controller and JSP fragments returned.
Moving on, we also have to take into account web services. In this area, Retrace provides support for REST services built with Jersey, RESTEasy and, of course, with the Spring framework. Besides these, the tool also includes support for SOAP web services and RMI.
And since most applications require working with HTTP requests, Retrace also offers monitoring for standard JDK HTTP API, as well as two other widely-used libraries: Apache HTTP Client and Apache Commons HTTP.
In the persistence realm, you’ll find monitoring for standard SQL databases including MS SQL, MySQL, PostgresSQL, and Oracle. This applies to accessing databases through both standard JDBC and JPA. Note that NoSQL data sources such as HBASE, Cassandra and MongoDB are also well-supported.
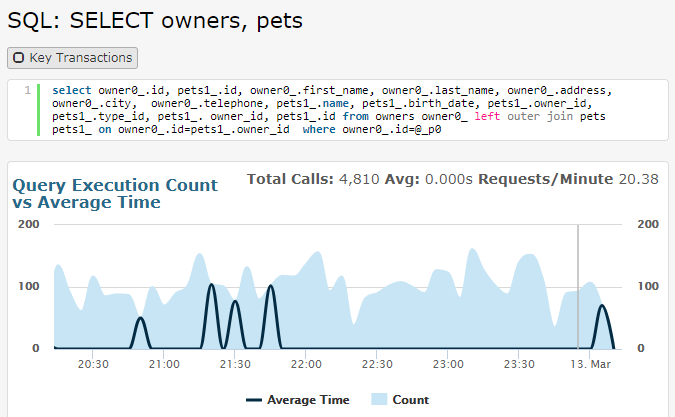
For example, for every database access, Retrace can show you the SQL query generated based on an ORM tool:

In the image above, you can also analyze the average time of execution of the query compared to the execution count.
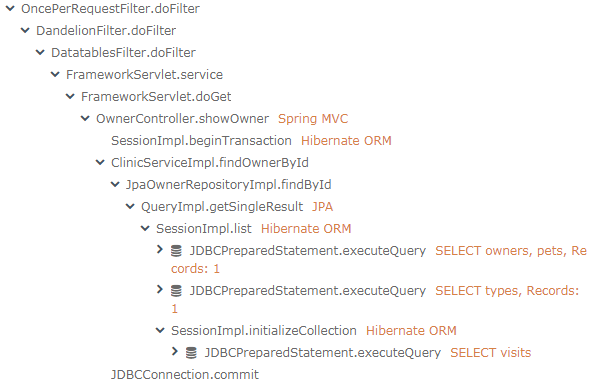
If you want to track the ORM call that generated the query, you can find this by following the request trace:

Here, you can see information from the filters that intercept the request to the Spring MVC mapping, and then the JPA and Hibernate calls in the stack.
Another interesting feature is support for asynchronous processing – to help you make use of Java’s powerful multi-threading capabilities.
In the realm of scheduling frameworks, Retrace provides out of the box support for both Quartz and Spring Batch frameworks.
Finally, a worthy mention is the integration with applications that use the Java Service Wrapper from Tanuki Software.
Conclusion
The new Retrace release ensures that Java APM features are now available for both Unix and Windows systems.
This brings a wider coverage and support for all your performance monitoring needs, to make the information you need to diagnose issues and ensure a smooth functioning of your applications.
Also Read-https://stackify.com/5-hidden-performance-problems-for-asp-net/
Improve Your Code with Retrace APM
Stackify's APM tools are used by thousands of .NET, Java, PHP, Node.js, Python, & Ruby developers all over the world.
Explore Retrace's product features to learn more.
Learn More

