
When developing new applications, it’s typical to run into a variety of competitors with similar goals. This is one reason why it is not enough to create an application without ways to monitor and manage it. In fact, usually market leaders emerge rather quickly.
So who are these market leaders?
We often see these people and companies are the ones empowered through the use of technologies like Application Performance Management(APM), which help business owners and developers track application details to find and fix problems quickly. APMs generate information to help Ruby developers pinpoint exceptions and errors in real-time.
In this guide, we will cover how one APM tool, Retrace, performs data collection with Ruby applications to enable actionable insights.
In today’s digital landscape, competing websites can pop up overnight. However, market entry is only the start. Businesses needed to find ways to differentiate themselves in order to gain market share. Bidding wars are prevalent, so it’s not as simple as just showing up.
Leaders can quickly establish a competitive advantage when they focus on the needs of their customers. APMs help developers ensure they are meeting their customers’ needs, while also allowing developers to remain focused on their main priority: building new features. Retrace’s agent monitors Ruby applications to improve customer experience and help prioritize business decisions.
Ruby developers want to develop powerful, yet efficient, applications.
In the digital age, speed is everything.
Ruby has frameworks such as Rails and Sinatra to help developers build robust and elegant applications in a more efficient and less troublesome way. To optimize application performance, code-level APM is needed to ensure a strong emphasis on the overall health of the application. Retrace works harmoniously with Ruby applications to proactively and correctly leverage usage-driven insights. It gathers these insights, unifies them, and serves as a catalyst to improve business decisions. Retrace monitors applications and pinpoints the root cause of the problems swiftly. Most of all, Retace provides performance metrics to forecast emergency situations.
The key metrics to track a specific Ruby application include:
Retrace provides you with an in-depth analysis of your web application to ensure the best user experience. Its core competency is to resolve the performance problem and find root causes before they disrupt vital and critical services within your application. HTTP checks are executed near real-time, which provides clear visibility. Even small malfunctions are quickly analyzed. At any given instance, an application must respond successfully (HTTP 200). This feature in Retrace’s APM prevents a problem before it disrupts critical services.
Technology is synonymous with business. In this digital era, internet traffic is directly related to revenue. Therefore, when a website takes forever to load, users lose patience and your reputation suffers. With so many different types of applications, developers must constantly monitor application health.
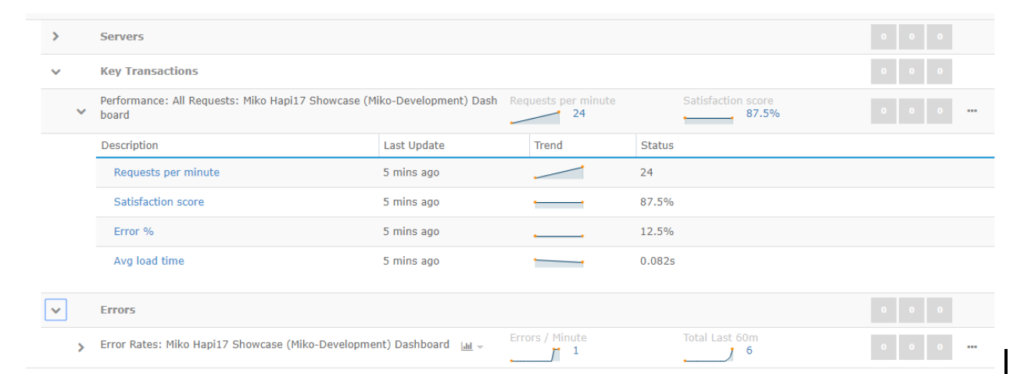
There are two common approaches: reactive and proactive. Any business should strive for a sustainable competitive advantage. Proactivity and consistency when dealing with customers’ needs through developing operational and effective applications are crucial. In Retrace, these key elements are known as “key transactions.”
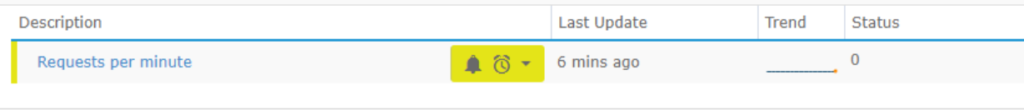
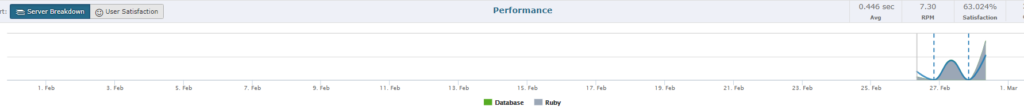
The most reliable approach to competing in this dynamic world is to utilize programming languages that are already established with rich functionality and interactivity. Ruby is a relatively popular programming language, especially in the open source developer community. Due to the complexity of the language, it’s important to have flexibility on what specific key transactions must be checked. The good thing with Retrace is that it offers features wherein you can either “acknowledge all” or “specify an alert” by navigating into the monitoring tab and clicking the ‘Current Alerts’ tab. Traffic is an application’s primary performance metric. A sudden drop in website traffic, especially during peak hours, indicates a critical problem. As shown below, we have configured the “requests per minute” feature.
Every developer knows that errors integrated with log files are critical when locating the source of the problem. Developers immediately examine errors as they happen. These exceptions can be identified in Retrace, whether it’s a simple glitch or processes that could shut down the application. Nevertheless, exceptions are considered symptoms and must be resolved to prevent performance problems.
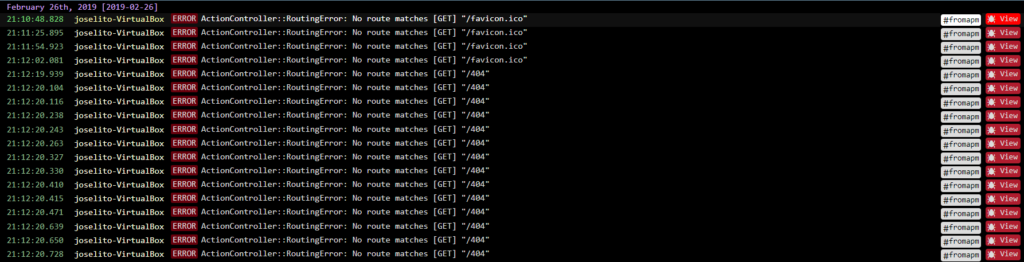
By clicking the “Error” tab, this sample Ruby app encountered a few spikes as shown below:

To ensure that application or system issues can be caught in time, all exceptions thrown by the Ruby application are stored. To effectively manage everything, these can be accessed by the customers in real-time. Retrace provides insights that help avoid unplanned downtime. Vital information such as errors per minute, errors per hour, and the total errors are easy to get to and track in the system.
Retrace’s error tracking and monitoring features accelerate exception tracking. Errors can come in a single instance or a burst. Retrace notifies users via email in real time. It is a must that you constantly monitor your dashboard in order to consistently track application performance and error status.
The complexity of an application is directly related to the volume of its errors. Retrace is a premier APM that offers minimal complexity due to its robust de-duplication of errors.Most of the time, the duplicate errors will occur over a short period of time. Retrace summarizes the number of error occurrences for a simple view.
The total number of occurrences, date, time and error names are shown below:

An APM that can monitor SQL performance is a good prerequisite for ruby performance monitoring. The bidirectional relationship between server and database fuels application performance and is a vital component to the overall health of the application. Retrace provides unmatched SQL performance metrics to ensure that the SQL server runs smoothly and efficiently.
Retrace can also help with performance tuning in SQL Server.
It is important to examine slow queries as part of Ruby application performance assessment. Retrace has the capability to monitor SQL queries and most of all, it can identify slow queries. Simply check the dashboard for performance of the various running queries to identify any inefficient behavior. You can see key data such as the number of calls, average time and percentage of calls. The figure below shows comprehensive slow query information from Retrace.
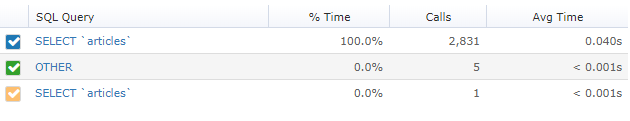
Performance might seem perfectly fine at the start for every Ruby or any web application. However, performance issues usually arise at the database level. When an application executes too many SQL queries, it may result in a slow request process. Accessing the database, especially with a large database that is accessed frequently, will severely degrade application performance. Retrace delivers relevant metrics regarding SQL queries in order to trace SQL query performance.
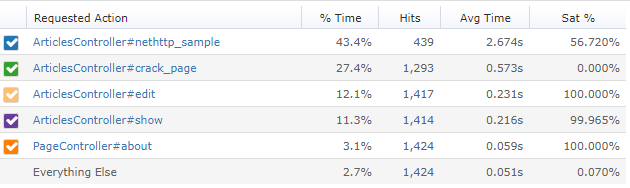
There are many factors to consider when measuring the performance of a Ruby application, such as the efficiency of the application itself, its architecture design, and coding structure. Developers use query metrics to aid in streamlining its fast performance and efficiency. An APM that can monitor critical queries used the most is a huge advantage. This can be considered one factor that contributes to the slow performance of a Ruby application. APMs were created for developers and developer teams to help discover specific queries affecting application performance.
There are a lot of factors that go into ruby performance monitoring. One factor is application dependencies, which is why mapping application dependencies
Simplify managing the total performance of your application, dependencies such as MongoDB, Redis, Elastic Search, and others must be considered. Retrace will automatically identify common dependencies. The supported technologies for Ruby are found here.
Retrace offers information about your application’s dependency performance. Applications scrutinize dependencies according to compatibility. It is an integrated tool to quantify the speed and efficiency of the application and ensure the best user satisfaction. These dependencies feed crucial management information that improve service quality.
Stackify utilizes Microsoft Azure or Amazon Web Service (AWS) products as its dependencies. These are designed to support diverse services such as caching, storage, and queueing. In Azure, for example, features such as Cloud Service, App Service, Azure Functions, Virtual Machines, and SQL Elastic Pools are utilized.
Retrace’s APM provides deep analysis of your applications using the integrated dependencies mentioned above. Adding dependencies has its advantages and disadvantages. It’s unacceptable when a particular dependency disrupts the critical services of your application. Retrace quickly identifies and resolves problems associated with application dependencies. Another unique attribute of Retrace is its capability to quickly identify if the performance problems are related to your own code or an external dependency. The figure below shows the available dependencies covering a simple Ruby application.
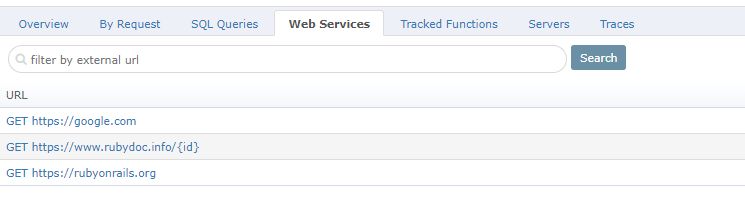
When applications handle a huge number of web services daily, they need to be designed to serve external applications.
External Web services are equally important with application dependencies. With Retrace, you can monitor the performance of these integrations.
Logs are hidden gems ready to be mined by Retrace. The debugging process helps developers in application troubleshooting. These logs provide insight into hidden threats. Once found, these threats are interpreted and converted into sound decisions. Retrace is capable of mining and converting this data into useful information.
You can view and search all of your Ruby logs across every environment, application, and server. This makes it easy to quickly troubleshoot problems with your Ruby applications.
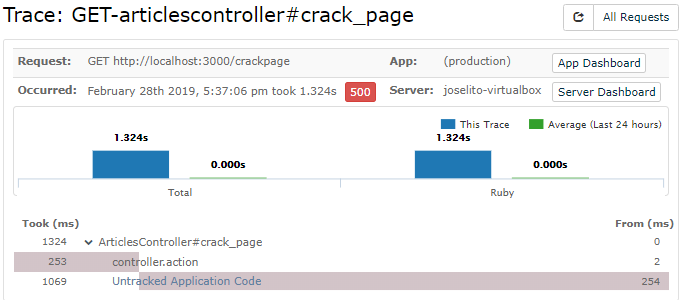
Retrace lets you retrace what your code is doing. Troubleshooting application performance problems is often the key in achieving software quality, however it is a tedious process. To address that problem, Retrace provides a detailed Ruby request tracing process down to the code level. It automatically collects traces of all of your requests and tracing is possible.
Simplify your application monitoring across various IT applications with Retrace. Hopefully, this guide introduced you to the basic elements of Ruby performance monitoring using Retrace. The ability to foresee potential failures and pinpoint key transactions that constitute failure is a great advantage. Modern web application technology trends continue to amaze us and APMs are essential. APMs are huge benefit to business owners and developers as they can drastically reduce troubleshooting time. Most of all, APMs like Retrace provide speedy support to achieve high-quality application performance.
Stackify's APM tools are used by thousands of .NET, Java, PHP, Node.js, Python, & Ruby developers all over the world.
Explore Retrace's product features to learn more.


