New Relic is one of the industry leaders for SaaS-based application performance management. However, many are starting to look for new relic alternatives and competitors. Probably about half of those alternatives are available as SaaS APM.
We talk to companies every day that are currently using New Relic but are looking for alternatives for a few different reasons:
“There are several other options that are in a much lower price bracket that cover the 80% case for most people.” – via G2Crowd Review
Their product is missing one of the most important things developers need to help troubleshoot problems and optimize their software. How many times in the office do you hear “send me the logs”? Log files can provide a wealth of information that can’t be known any other way.
New Relic’s solution to logging is integrations with other expensive logging products like Loggly, Logentries, and others. However, these integrations and alternatives don’t tightly integrate logging to code level traces and with today’s async applications, it is virtually impossible to match this data up across data sources.
Retrace includes advanced error and log management features as part of our standard pricing. We know how critical logs are and tightly integrating logging into code level transaction traces provides developers an unparalleled understanding of their applications.
Example Retrace trace showing logs, errors, SQL, redis and more
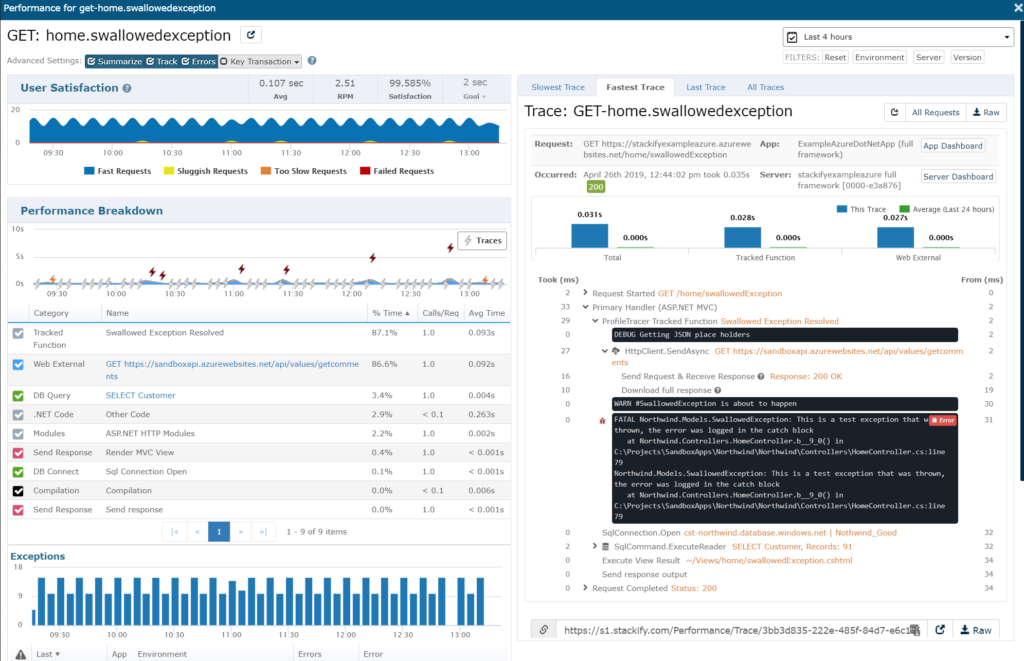
Retrace is entirely focused on helping developers find and fix application problems as fast as possible. Because of that, developers love Retrace because it is simple to use and easy to quickly identify application problems.
One thing we hear a lot is that Retrace provides more code-level details. Our goal is to help developers understand every millisecond spent in their code.
Traditionally APM products have been too expensive to use in QA environments. We would argue that they are vital there to find problems before they get to production. Retrace includes special functions designed for QA.
We’re still a small (but growing) software company just as dedicated to our original mission as ever. One of the biggest contributing factors to our continued growth has been the collaborative relationship we forge with our customer community. When you reach out to us you get a real developer not a call center technician.
We aren’t focused on extracting huge sums of money and focusing on just large enterprises. Sadly, many APM providers like New Relic focus only on the big guys. We believe that by providing the best value and customer support, we’ll succeed. Our software and business model is designed to reach development teams of all shapes and sizes.
Stackify’s products are used by over 1100 customers in over 50 countries. Retrace is designed for developers from the ground up, and they love them. If you are looking at New Relic competitors, make sure Retrace is on your list.
Want to know more about how Retrace compares to New Relic’s APM? Download this free e-book for an apples to apples comparison.
Stackify's APM tools are used by thousands of .NET, Java, PHP, Node.js, Python, & Ruby developers all over the world.
Explore Retrace's product features to learn more.


