The Java Performance Testing Guide With Code
By: Eugen
| January 2, 2018

1. Introduction
In this article, we’ll discuss Java performance testing approaches that can be helpful for improving the performance of a Java application. We’ll start with how to define measurable performance goals and then look at different tools to measure, monitor application performance and identify bottlenecks.
We’ll also look at some of the common Java code level optimizations as well as best coding practices. Finally, we’ll look at JVM specific tuning tips and architectural changes to improve the performance of a Java application.
Note that performance optimization is a wide topic, and this is only a starting point for exploring it on the JVM.
2. Java Performance Testing Goals
Before we start working on improving the performance of the application, we need to define and understand our non-functional requirements around key areas such as scalability, performance, availability, etc.
Here are a few frequently used Java performance testing goals for typical web applications:
- Average application response time
- Average concurrent users must the system support
- Expected requests per second during peak load
Using metrics like these which can be measured via different load testing and application monitoring tools helps to identify key bottlenecks and tune performance accordingly.
3. Sample Application
Let’s define a baseline application we can use throughout this article. We’ll use a simple Spring Boot web application – as the one we created in this article. This application is managing a list of employees and exposes REST APIs for adding an employee and retrieving existing employees.
We will use this as the reference to run load tests and monitor different application metrics in the upcoming sections.
4. Identifying Bottlenecks
Load testing tools and Application Performance Management (APM) solutions are commonly used for Java performance testing. Running load tests around different application scenarios and simultaneously monitoring CPU, IO, Heap usage, etc. using APM tools are key to identifying bottlenecks.
Gatling is one of the best tools for load testing which provides excellent support of the HTTP protocol – which makes it an excellent choice for load testing any HTTP server.
Stackify’s Retrace is mature APM solution with a rich set of features – so naturally, that’s a great way to go to help you determine the baseline of this application. One of the key components of Retrace is its code profiling which collects runtime information without slowing down the application.
Retrace also provides widgets for monitoring Memory, Threads, and Classes for a running JVM based application. Other than application metrics, it also supports monitoring CPU and IO usage of the server which is hosting our application.
So, a full-fledged monitoring tool such as Retrace covers the first part of unlocking the performance potential of your application. The second part is actually being able to reproduce real-world usage and load in your system.
That’s actually harder to achieve than it looks, and it’s also critical to understand the current performance profile of the application. That’s what we’re going to be focusing on next.
5. Gatling Load Test
Gatling simulation scripts are written in Scala, but the tool also comes with a helpful GUI, allowing us to record scenarios. The GUI then creates the Scala script representing the simulation.
And, after running the simulation, we Gatling generates helpful, ready-to-analyze HTML reports.
5.1. Define a Scenario
Before launching the recorder, we need to define a scenario. It will be a representation of what happens when users navigate a web application.
In our case, the scenario will be like let us start 200 users and each makes 10,000 requests.
5.2. Configuring the Recorder
Based on Gatling first steps, create a new file EmployeeSimulation scala file with the following code:
class EmployeeSimulation extends Simulation {
    val scn = scenario("FetchEmployees").repeat(10000) {
        exec(
          http("GetEmployees-API")
            .get("http://localhost:8080/employees")
            .check(status.is(200))
        )
    }

    setUp(scn.users(200).ramp(100))
}
5.3. Run Load Test
To execute the load test, let’s run the following command:
$GATLING_HOME/bin/gatling.sh -s basic.EmployeeSimulation
After running the simulation here’s what the results look like (for 200 users):
> request count                               2000000 (OK=1758902 KO=241098)
> min response time                             75    (OK=75     KO=0)
> max response time                          44916    (OK=44916  KO=30094)
> mean response time                          2193    (OK=2063   KO=11996)
> std deviation                               4185    (OK=3953   KO=7888)
> response time 50th percentile                506    (OK=494    KO=13670)
> response time 75th percentile               2035    (OK=1976   KO=15835)
> mean requests/sec                          3.208    (OK=3.166  KO=0.042)
---- Response Time Distribution ----------------------------------------
> t < 800 ms                                          1752 ( 57%)
> 800 ms < t < 1200 ms                                 220 (  7%)
> t > 1200 ms                                         1046 ( 35%)
> failed                                                40 (  1%)
Note that some of the requests failed when tested for multiple simultaneous users.
Load testing the API’s of an application is helpful in finding subtle, hard to find bugs like DB connections getting exhausted, requests getting timed out during high loads, undesirable high heap usage due to memory leaks, etc.
6. Monitoring the Application
To get started with using Retrace for Java performance testing, the first step is to sign up for a free trial here, on Stackify.
Next, we’ll need to configure our Spring Boot application as Linux service. We’ll also need to install Retrace agent on the server where our application is hosted as mentioned here.
Once we have started the Retrace agent and Java application to be monitored, we can go to Retrace dashboard and click AddApp link. Once this is done, Retrace will start monitoring our application.
6.1. Find the Slowest Part Of Your Stack
Retrace automatically instruments our application and tracks usage of dozens of common frameworks and dependencies, including SQL, MongoDB, Redis, Elasticsearch, etc. Retrace makes it easy to quickly identify why our application is having performance problems like:
- Is a certain SQL statement slowing us down?
- Is Redis slower all of a sudden?
- Specific HTTP web service down or slow?
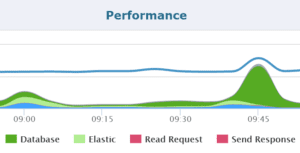
For example, below graph provides insights around slowest part of the stack over a given time duration.

7. Code Level Optimizations
Load testing and application monitoring are quite helpful in identifying some of the key bottlenecks during Java performance testing. But at the same time, we need to follow good coding practices in order to avoid a lot of performance issues before we even start application monitoring.
Let’s look at some of the best practices in the next section.
7.1. Using StringBuilder for String Concatenation
String concatenation is a very common operation, and also an inefficient one. Simply put, the problem with using += to append Strings is that it will cause an allocation of a new String with every new operation.
Here’s, for example, a simplified but typical loop – first using raw concatenation and then, using a proper builder:
public String stringAppendLoop() {
    String s = "";
    for (int i = 0; i < 10000; i++) {
        if (s.length() > 0)
            s += ", ";
        s += "bar";
    }
    return s;
}

public String stringAppendBuilderLoop() {
    StringBuilder sb = new StringBuilder();
    for (int i = 0; i < 10000; i++) {
        if (sb.length() > 0)
            sb.append(", ");
        sb.append("bar");
    }
    return sb.toString();
}
Using the StringBuilder in the code above is significantly more efficient, especially given just how common these String-based operations can be.
Before we move on, note that the current generation of JVMs does perform compile and or runtime optimizations on Strings operations.
7.2. Avoid Recursion
Recursive code logic leading to StackOverFlowError is another common scenario in Java applications.
If we cannot do away with recursive logic, tail recursive as an alternative is better.
Let’s have a look at a head-recursive example:
public int factorial(int n) {
    if (n == 0) {
        return 1;
    } else {
        return n * factorial(n - 1);
    }
}
And let’s now rewrite it as tail recursive:
private int factorial(int n, int accum) {
    if (n == 0) {
        return accum;
    } else {
        return factorial(n - 1, accum * n);
    }
}

public int factorial(int n) {
    return factorial(n, 1);
}
Other JVM languages, such as Scala, already have compiler-level support to optimize tail recursive code, and there’s discussion around bringing this type of optimization to Java as well.
7.3. Use Regular Expressions Carefully
Regular expressions are useful in a lot of scenarios, but they do, more often than not, have a very performance cost. It’s also important to be aware of a variety of JDK String methods, which use regular expressions, such as String.replaceAll(), or String.split().
If you absolutely must use regular expressions in computation-intensive code sections, it’s worth caching the Pattern reference instead of compiling repeatedly:
static final Pattern HEAVY_REGEX = Pattern.compile("(((X)*Y)*Z)*");
Using a popular library like Apache Commons Lang is also a good alternative, especially for manipulation of Strings.
7.4. Avoid Creating and Destroying too Many Threads
Creating and disposing of threads is a common cause of performance issues on the JVM, as thread objects are relatively heavy to create and destroy.
If your application uses a large number of threads, using a thread pool makes a lot of sense, to allow these expensive objects to be reused.
To that end, the Java ExecutorService is the foundation here and provides a high-level API to define the semantics of the thread pool and interact with it.
The Fork/Join framework from Java 7 is also well-worth mentioning, as it provides tools to help speed up parallel processing by attempting to use all available processor cores. To provide effective parallel execution, the framework uses a pool of threads called the ForkJoinPool, which manages the worker threads.
To do a deeper dive into thread pools on the JVM, this is a great place to start.
8. JVM Tuning
8.1. Heap Size Tuning
Determination of proper JVM heap size for a production system is not a straightforward exercise. The first step is to determine predictable memory requirements by answering following questions:
- How many different applications we are planning to deploy to a single JVM process, e.g., the number of EAR files, WAR files, jar files, etc.
- How many Java classes will be potentially loaded at runtime; including third party API’s
- Estimate the footprint necessary for in-memory caching, e.g., internal cache data structures loaded by our application (and third party API’s) such as cached data from a database, data read from a file, etc.
- Estimate the number of Threads that the application will create
These numbers are difficult to estimate without some real-world testing.
The most reliable way to get a good idea about the what the application needs are – is to run a realistic load test against the application and track metrics at runtime. The Gatling-based tests we discussed earlier are a great way to do that.
8.2. Choosing the Right Garbage Collector
Stop-the-world garbage collection cycles used to represent a huge issue for the responsiveness and overall Java performance of most client-facing applications.
However, the current generation of garbage collectors has mostly solved that issue and, with proper tuning and sizing, can lead to having no noticeable collection cycles. That being said, it does take an in-depth understanding of both GC on the JVM as a whole, but also the specific profile of the application – to get there.
Tools like a profiler, heap dumps, and verbose GC logging can certainly help. And again, these all need to be captured on real-world load patterns, which is where the Gatling performance tests we discussed earlier come in.
For more information around different Garbage Collectors, have a look at this guide here.
9. JDBC Performance
Relational databases are another common performance problem during Java performance testing. In order to get to a good response time for a full request, we have to naturally look at each layer of the application and consider how the code interacts with the underlying SQL DB.
9.1. Connection Pooling
Let’s start with the well-known fact that database connections are expensive. A connection pooling mechanism is a great first step towards addressing that.
A quick recommendation here is HikariCP JDBC – a very lightweight (at roughly 130Kb) and lightning fast JDBC connection pooling framework.
9.2. JDBC Batching
Another aspect of the way we handle persistence is trying to batch operations wherever possible. JDBC batching allows us to send multiple SQL statements in a single database roundtrip.
The performance gain can be significant both on the Driver and the database side. PreparedStatement is an excellent candidate for batching, and some database systems (e.g., Oracle) support batching for prepared statements only.
Hibernate, on the other side, is more flexible and allows us to switch to batching with a single configuration.
9.3. Statement Caching
Next, statement caching is another way to potentially improve the performance of our persistence layer – a less-known performance optimization that you can easily take advantage of.
Depending on the underlying JDBC Driver, you can cache PreparedStatement both on the client-side (the Driver) or databases-side (either the syntax tree or even the execution plan).
9.4. Scale-Up and Scale-Out
Database replication and sharding are also excellent ways to increase throughput, and we should take advantage of these battle-tested architectural patterns to scale persistent layer of our enterprise application.
10. Architectural Improvements
10.1. Caching
Memory prices are low and getting lower, and retrieving data from disk or via a network is still expensive. Caching is certainly one aspect of application performance we shouldn’t overlook.
Of course, introducing a stand-alone caching system into the topology of an application does add complexity to the architecture – so a good way to start leveraging caching is to make good use of existing caching capabilities in the libraries and frameworks we’re already using.
For example, most persistence frameworks have great caching support. Web frameworks such as Spring MVC can also leverage the built-in caching support in Spring, as well as the powerful HTTP-level caching based on ETags.
But, after all of the low-hanging fruit is picked, caching frequently accessed content in the application, in a stand-alone caching server such as Redis, Ehcache or Memcache can be a good next step – to reduce database load and provide a significant boost to application performance.
10.2. Scaling Out
No matter how much hardware we throw at a single instance, at some point that won’t be enough. Simply put, scaling up has natural limitations, and when the system hits these – scaling out is the only way to grow, evolve and simply handle more load.
Unsurprisingly, this step does come with significant complexity, but it’s nevertheless the only way to scale an application after a certain point.
And, support is good and always getting better, in most modern frameworks and libraries. The Spring ecosystem has an entire group of projects specifically built to address this particular area of application architecture, and most other stacks have similar support.
Finally, an additional advantage of scaling with the help of a cluster, beyond pure Java performance – is that adding new nodes also leads to redundancy and better techniques of dealing with failure, leading to overall higher availability of the system.
11. Conclusion
In this article, we explored a number of different concepts around Java performance testing. We started with load testing, APM tool based application and server monitoring – followed by some of the best practices around writing performant Java code.
Finally, we looked at JVM specific tuning tips, database side optimizations, and architectural changes to scale our application.
Improve Your Code with Retrace APM
Stackify's APM tools are used by thousands of .NET, Java, PHP, Node.js, Python, & Ruby developers all over the world.
Explore Retrace's product features to learn more.
Learn More


