As developers, we would rather be writing code all day than doing anything else. Especially meetings or fighting production problems. Unfortunately, both are part of the job. All developers need to understand the basics of web performance monitoring. It won’t help you get out of meetings, but it will help prevent production fires and put them out faster. Although, I guess it might also help you avoid meetings about production problems.
Web performance monitoring is a mixture of web application monitoring techniques to ensure that your application is online, loading quickly, and working correctly. As you know, it is possible for your web application to be online and loading quickly, but returning an error every time. It is important to monitor your application in multiple different ways to ensure your entire application stack is working correctly.
As some say, “Performance is a feature”.
If I go to order pizza online and their website is being really slow or throwing errors, I will just order pizza from somewhere else. Next time, I might remember that bad experience and not even go back to that other pizza restaurant.
Google found that reducing the speed of Google searches by just 400 milliseconds would cause 8,000,000 fewer searches to be run every day.
Monitoring the performance of your web application is critical to ensure that all of your customers are happy.
In this guide, we are going to cover a few things that every developer needs to know about web performance monitoring.
The easiest part of web performance monitoring is ensuring your web application is online and available for your users. The best way to do application availability monitoring is with a simple HTTP ping monitor that runs every minute.
For example, we use this at Stackify to monitor our various web applications and marketing websites. We can monitor the response time and ensure that they are responding with an HTTP status code of 200.
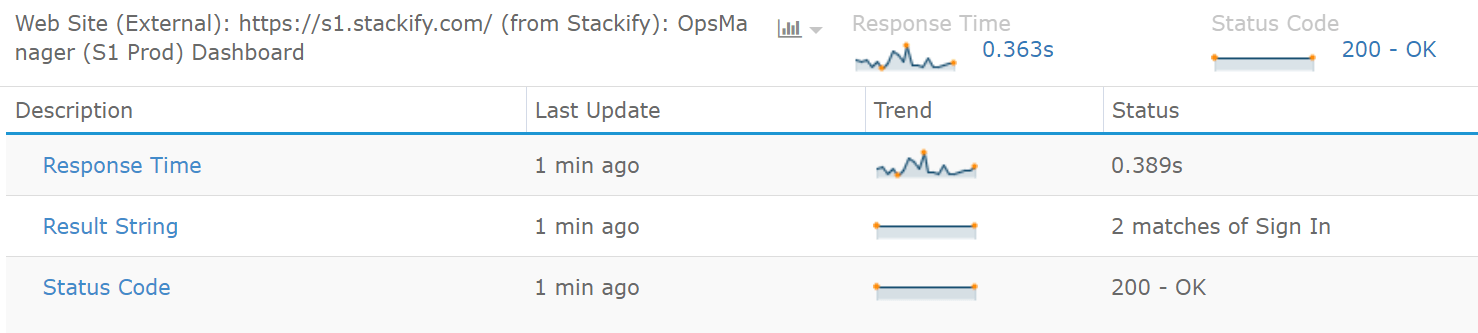
Most monitoring tools even allow you to check for specifying text as part of the response. This is useful to ensure that the page is not only loading with a 200 HTTP status code but returning a proper response. In the previous example, we are looking for “Sign In” on our log in page.
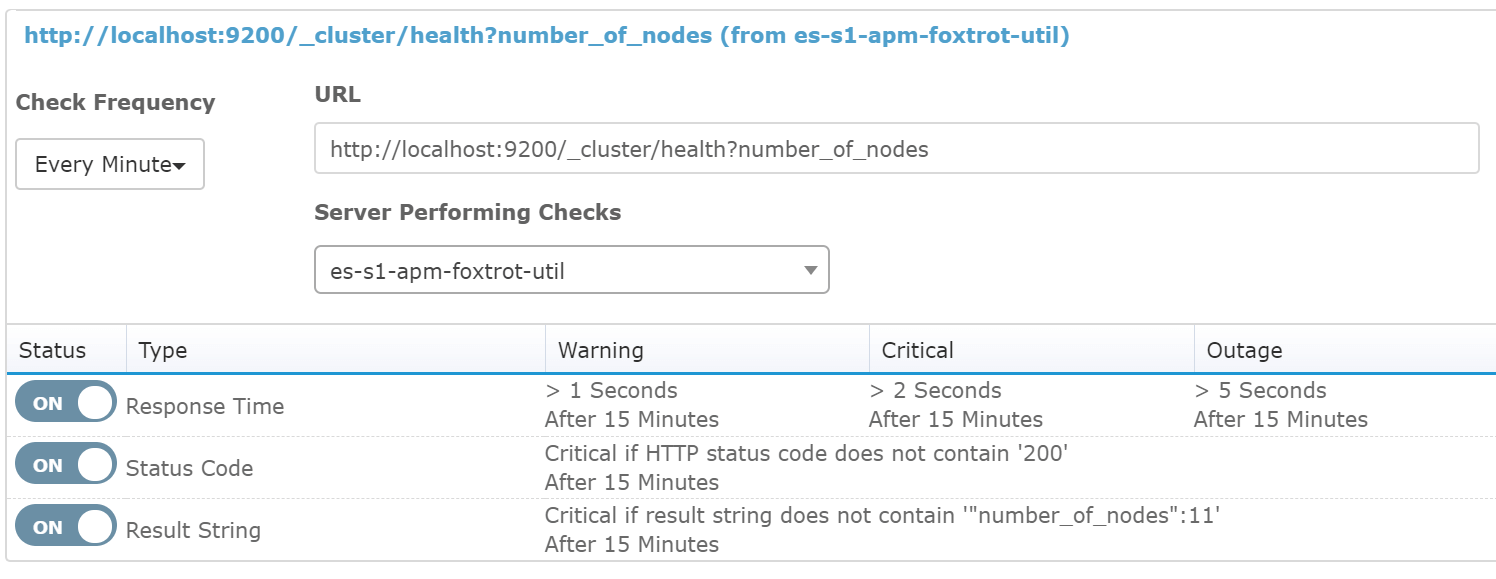
As another example, we also use it to monitor our Elasticsearch cluster. We can look for specific text like “number_of_nodes”:11 to know if the correct number of Elasticsearch nodes is up and running. These types of HTTP checks can be very useful for a wide array of things!
If your web application is not working correctly, your error logs are your first line of defense. You should immediately check your error logs for potential problems.
For example, a couple of days ago our system was working fine but was running really slow. We received an alert from Retrace about page load times being too high and high error rates. Following the alert, we checked our error monitoring dashboard, and this is what we saw below.
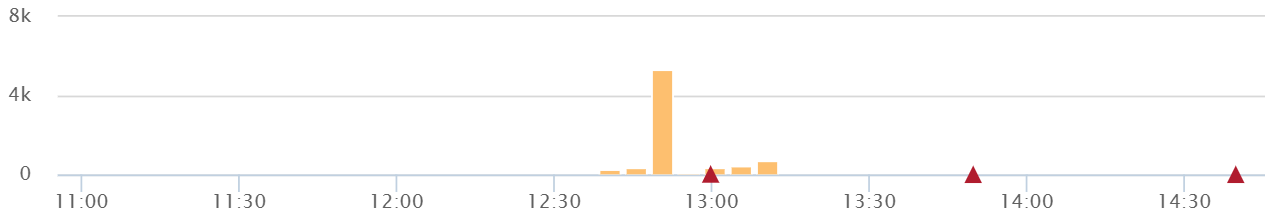
We could instantly see a big spike in exceptions around 12:45. It also showed us that we had two specific exceptions that were happening a lot.
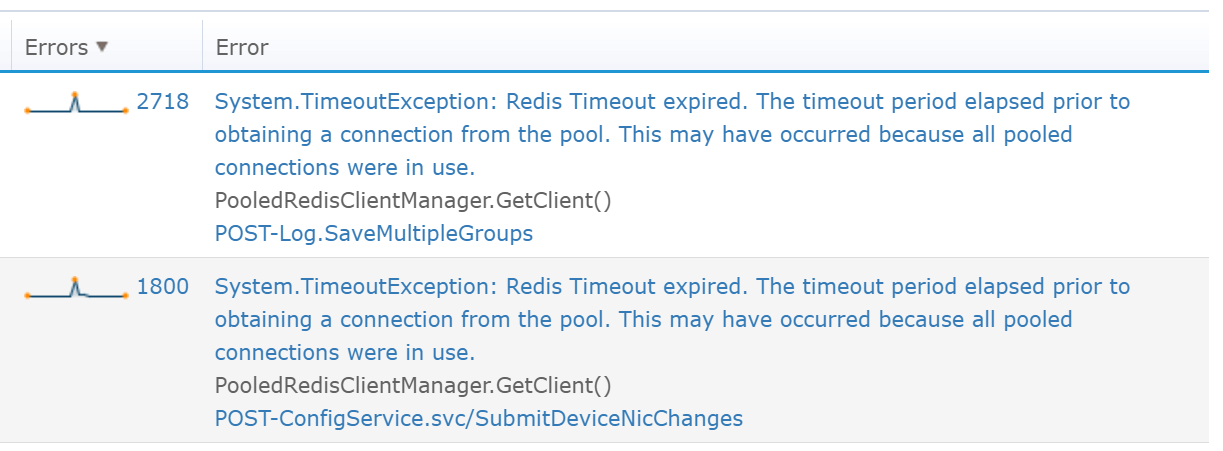
Thanks to having these errors, we knew exactly where to dig deeper. It was the smoke from the production fire that we needed. Our exception logs pointed us directly to Redis as being a problem in this instance. Since our applications rely heavily on Redis for caching, any issue with it definitely causes some problems.
On that day, the issue ended up going away on its own. Azure was having some weird issue with their Redis hosting for a few minutes.
Error monitoring is a critical component of web application performance monitoring. You should send all of your application errors to an error monitoring and reporting service.
Every application has important web requests or “key transactions” that should be closely monitored. Depending on your type of web application, it could be a wide variety of things. What you need to monitor for an e-commerce site is very different than a REST API.
Here are some of the common things to consider monitoring:
Let me provide some more details with a couple of good examples.
A long time ago I worked on a CRM application. It had one specific page that did a ton of SQL queries to load a lot of details about a customer. We had to load things about what they had purchased, contact history, notes, etc.
This particular page was one of the most used pages in our CRM software. Any little hiccup in performance due to slow SQL queries quickly caused this page to load slowly.
By monitoring the performance of this particular page, we could help ensure our software was running well and our users would be happy. It was the perfect way for us to measure the “pulse” of the performance of our entire application.
My next example is essentially a microservice. It is simple web service application that gets a ton of traffic to one specific web request. It may be a simple web application, but the performance of this particular web request is absolutely mission critical for our business.
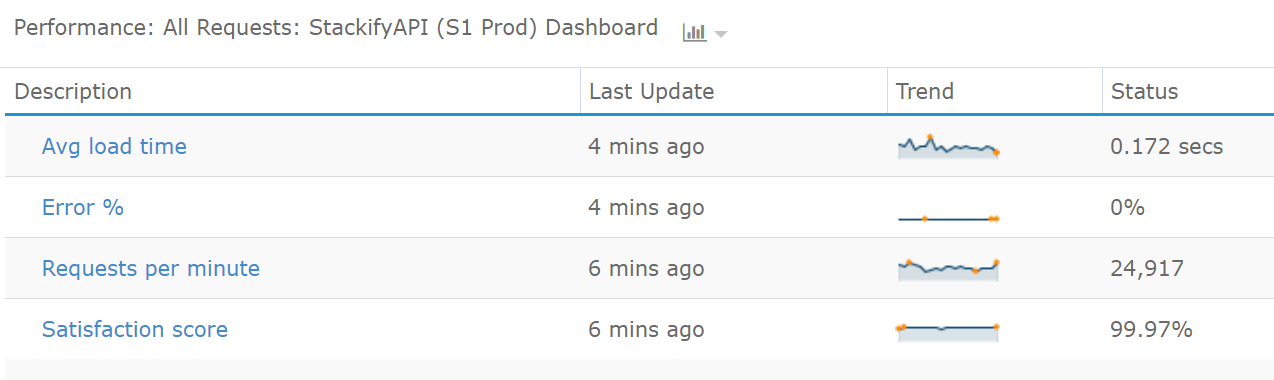
The API request handles all of the log data uploaded to our log management system. This single transaction gets called hundreds of time per second. By setting up a key transaction monitor within Retrace, we can closely monitor the performance of this specific API transaction or the entire application.
We can monitor the average response time, error rate, requests per minute or the calculated satisfaction score.
Today’s applications rely on numerous application dependencies. Include SQL databases, NoSQL, caching, and usually multiple external web services. If you want comprehensive web performance monitoring, you need to monitor your entire application stack.
To monitor how application dependencies affect the performance of your application, you need a tool, like Retrace, that can track the performance of your application down to the code level. Retrace automatically supports dozens of frameworks like SQL Server, Oracle, MongoDB, Elasticsearch, Redis, and many others.
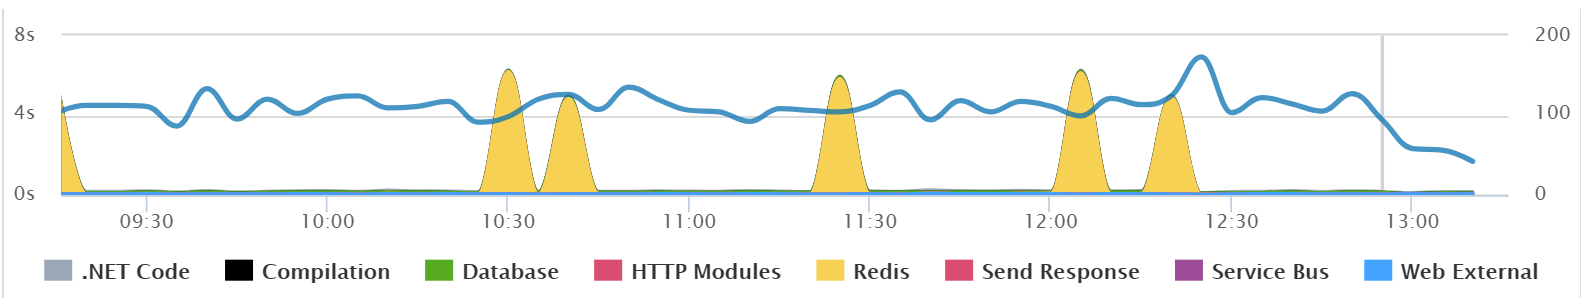
For example, in the screenshot below you can see how each application dependency impacts the overall performance of the application. You can quickly see that for some reason Redis is causing some performance problems based on the big yellow spikes in the graph.
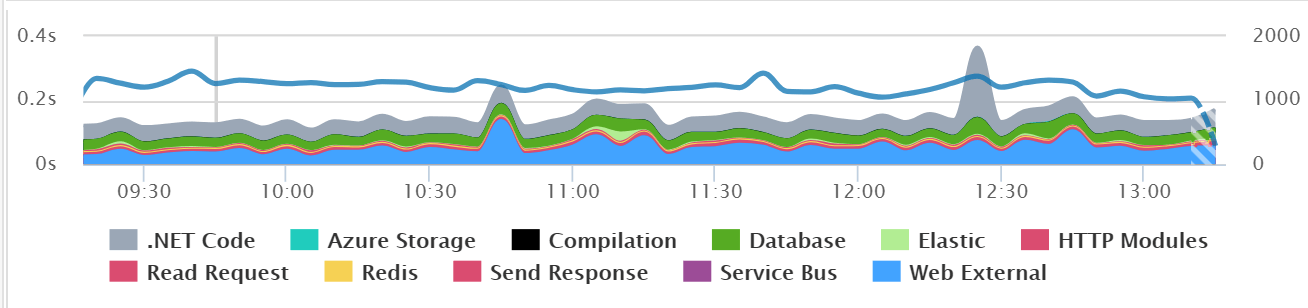
Here is another example from an application that is not having any major issues. Requests are typically loading under 200 milliseconds. However, you can also see that a good part of the time is spent on “Web External” which is external HTTP web service calls. Upon further research, the application was calling an external web service too often. I would have never noticed this any other way!
From the chart below you can also see how it tracks Azure Storage, Database, Elasticsearch, Redis, Azure Service Bus, and external HTTP services. If any part of our application stack has a spike in performance, this chart will help us instantly identify it.
Understanding the performance of your application dependencies is really important. These types of insights are invaluable for quickly identifying application performance problems or opportunities for optimization.
By the way, our product Retrace makes this easy and starts at just $35 a month.
Monitoring key metrics about your application and its frameworks is critical to web performance monitoring. For example, your web server can provide metrics around how many requests per second you are receiving. The .NET Framework or JVM can provide key metrics around garbage collection statistics and many other things. These types of metrics are important to monitor and track over time.
It is also vital to monitor basic metrics about your servers—things like CPU, memory usage, disk performance, etc. Maxing out the CPU on your server is always going to cause web performance problems. But if that isn’t the problem, you will need application-specific metrics to dig deeper.
Odds are, you may also want to track some custom metrics that are unique to your application.
One thing we want to monitor with Retrace is how much data we are receiving. We receive terabytes of logs, errors, metrics and code-level performance data every week. To help better correlate with other metrics, we want to know how many log messages we are receiving per minute. This enables us to correlate things like server CPU, requests per second and other metrics.

We can do this by using Retrace’s custom metrics functionality. With just a couple of lines of code, we can report and then monitor our incoming app log count as part of our larger web performance monitoring strategy.
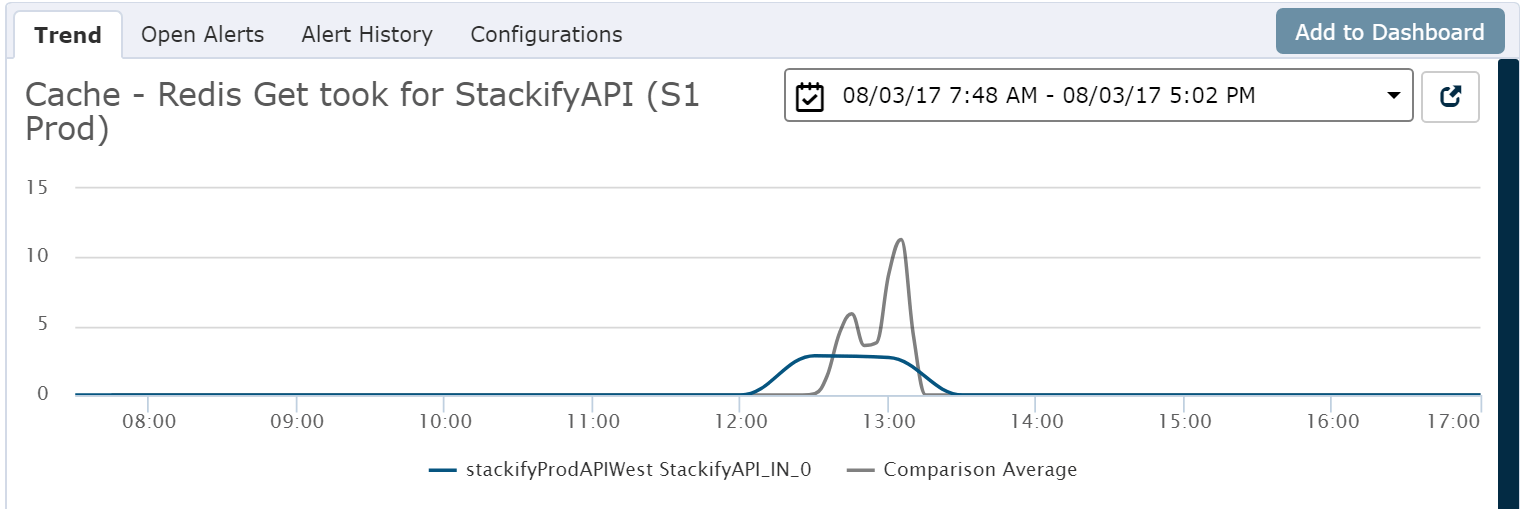
As another example, we also added some tracking around how we use Redis. It has some stats available on its end, but this enabled us to understand how exactly our code uses it.
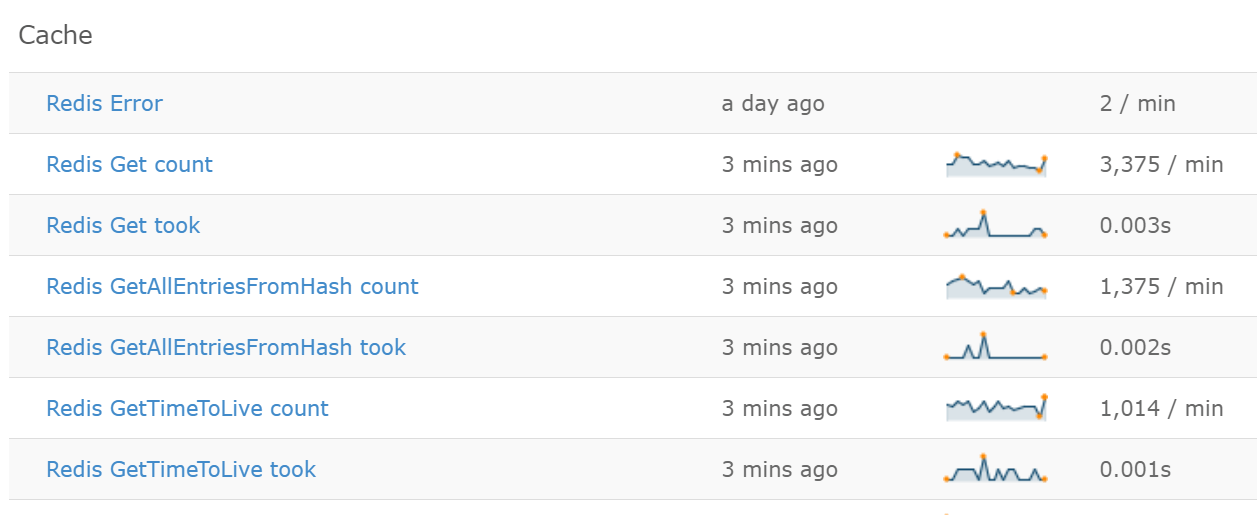
In the past, we happened to have an issue with Redis on Microsoft Azure. These metrics came in handy to help us quickly identify the problem.
OK, let’s face it, every software application is a snowflake. They all have a lot of common things that you can easily monitor, but there are usually some really specific things about your application that are critical to you. How do you monitor the weird stuff?
One of the most important things any business wants to monitor are the billing processes. The last thing we want is to forward incorrect billing to our customers.
Our billing process runs once a day in the middle of the night. It isn’t a web application. It’s a scheduled task handled by Quartz, our job scheduler. It really isn’t related to web performance monitoring, but it is critical to our web application. How do we monitor it?
We use really good error handling logic in our billing code and use a custom .NET exception type called BillingException. We then monitor our application logs with Retrace to look for any of those exceptions. If we see any of those in our logs, the red phone goes off and red lights start flashing everywhere (OK, maybe just an SMS alert that is sent).
At my last company, we had a contract with a car company that required that we send them data every day. That company sent us leads for people who wanted to buy cars. We processed the leads, and then our users did other activities with the data. We had to return data back to the car company about what was going on with those leads. Did the dealership contact those leads, was a car purchased, etc.?
So how do you monitor if you have done something or not?
In this case, our data model and processing are setup in a way that we could query a SQL Server to get a list of status changes that needed to be sent. We had a console application setup on a schedule to send them every hour or so.
To monitor that we were hitting our SLAs, we made another program running a similar query and alerted us if the query found any records.
If your application is vital to your business and your users, web performance monitoring is also crucial. In this guide, we looked at several different things that you should consider monitoring, including monitoring if your web application is up or down and the performance of specific web requests, metrics, errors and more.
All of the screenshots in this article are from our product Retrace. It is a fantastic solution for comprehensive web performance monitoring that can do everything described here and much, much more!
Stackify's APM tools are used by thousands of .NET, Java, PHP, Node.js, Python, & Ruby developers all over the world.
Explore Retrace's product features to learn more.


