
The Java Persistence API (JPA) is used in most Java applications to interact with a relational database. One of its most popular implementations is the Hibernate ORM, because it uses object-relational mapping to abstract database interactions and makes implementing simple CRUD operations very simple. But this abstraction also has its downsides. Hibernate uses a lot of internal optimizations and hides all database interactions behind its API. This post will show you how to detect Hibernate performance issues when your application is in development and production.
As a developer using Hibernate, you most often don’t know if or when Hibernate will execute an SQL statement for your call of a method on the EntityManager. That makes it hard to find inefficiencies and potential performance problems before they cause trouble in production. The best way to avoid these Hibernate performance issues is to monitor the database interactions during development, test and production.
There are lots of different ways you can do that. You can analyze your database logs, activate Hibernate’s internal logging, use a JDBC data source that logs all executed statements or use an external tool like Retrace to monitor your system.
All of these options can help you better understand how Hibernate interacts with the database. However, you should choose the tool you feel most comfortable with.
As a Java developer, I don’t like to work with database logs, and I know that I can’t always replace the JDBC data source. That’s why I prefer Hibernate’s internal logging and Retrace.
Let’s look at both options closely before showing you how you can use them to find different performance problems.
It’s no surprise that Hibernate Logging has all the information you need to understand how it interacts with the database. Hibernate writes log messages telling you:
As most frameworks and applications, Hibernate uses different categories and log levels to log this information. With the correct logging configuration, you get all the information you’re looking for. Let’s start with the logging of the executed SQL statements.
The best way to activate the logging of executed SQL queries is to set the log level of the category org.hibernate.SQL to DEBUG. Hibernate uses the configured logging framework to write the messages to the log file, and you can change it at any time without changing your deployed application.
You can see an example of a log4j configuration in the following code snippet, and you can fork the project with this and all following code snippets on github.
log4j.appender.stdout=org.apache.log4j.ConsoleAppender
log4j.appender.stdout.Target=System.out
log4j.appender.stdout.layout=org.apache.log4j.PatternLayout
log4j.appender.stdout.layout.ConversionPattern=%d{HH:mm:ss,SSS} %-5p [%c] - %m%n

log4j.rootLogger=info, stdout
# basic log level for all messages
log4j.logger.org.hibernate=info

# SQL statements and parameters
log4j.logger.org.hibernate.SQL=debug
When you activate this logging configuration, Hibernate will write a log message for each executed SQL statement.
14:36:39,325 DEBUG SQL:92 - select order0_.id as id1_1_, order0_.version as version2_1_ from purchase_order order0_ where order0_.id=1
The logging of all executed queries provides basic information about all database interactions, but Hibernate can do a lot more.
If you enable the Hibernate statistics component, it measures how long it takes to execute a query and summarizes the executed queries and execution times at the end of each session. That makes it a lot easier to get a general overview of your application and helps you to identify the sessions you should take a closer look at.
But be careful. Collecting all this information slows down your application, so you shouldn’t enable Hibernate statistics in your production environment.
You can activate the statistics component by setting the system property usihibernate.generate_statistics or a configuration parameter with the same name to true.
<persistence>
    <persistence-unit name="my-persistence-unit">
        <provider>org.hibernate.jpa.HibernatePersistenceProvider</provider>
        <properties>
            <property name="hibernate.generate_statistics" value="true" />

			...
        </properties>
    </persistence-unit>
</persistence>
Hibernate will then write a summary of all database interactions at the end of each session. As I will show you in a later part of this post, this summary is really helpful to find use cases where Hibernate executes too many SQL queries.
14:37:30,715  INFO StatisticalLoggingSessionEventListener:258 - Session Metrics {
    48986 nanoseconds spent acquiring 1 JDBC connections;
    23326 nanoseconds spent releasing 1 JDBC connections;
    259859 nanoseconds spent preparing 1 JDBC statements;
    1092619 nanoseconds spent executing 1 JDBC statements;
    0 nanoseconds spent executing 0 JDBC batches;
    0 nanoseconds spent performing 0 L2C puts;
    0 nanoseconds spent performing 0 L2C hits;
    0 nanoseconds spent performing 0 L2C misses;
    22383767 nanoseconds spent executing 1 flushes (flushing a total of 1 entities and 1 collections);
    72779 nanoseconds spent executing 1 partial-flushes (flushing a total of 0 entities and 0 collections)
}
When you activate the statistics component, you should also set the log level of the org.hibernate.stat category to DEBUG. Hibernate will then write a log message with the SQL statement, the number of returned rows and each query’s execution time to the log file.
14:38:05,231 DEBUG ConcurrentStatisticsImpl:387 - HHH000117: HQL: SELECT o FROM Order o WHERE id = 1, time: 48ms, rows: 1
With these settings, Hibernate provides you a lot of information that can help you find potential performance issues before they cause problems in production.
A potential downside of this approach is identifying all log statements that were triggered by a specific use case. This is especially challenging when you increase the log output on a production system or any other system used by multiple users in parallel.
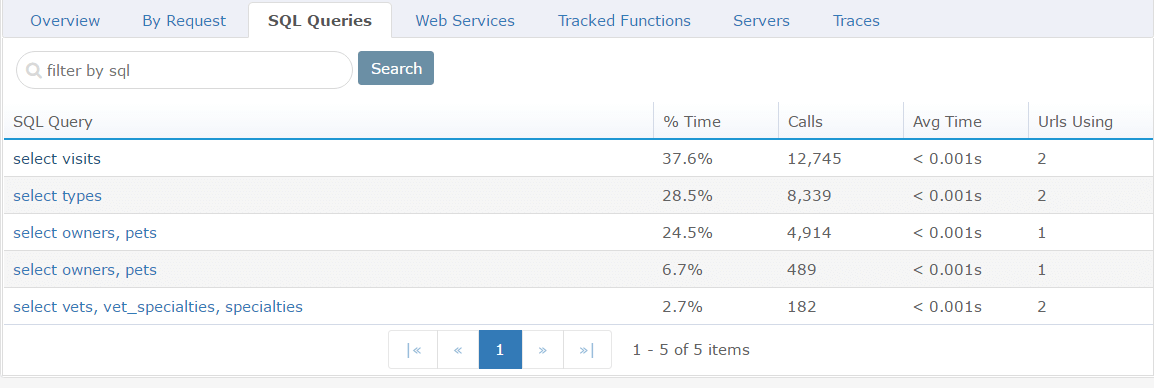
Keep in mind that collecting all this information and writing the additional log messages will slow down your application. So again, it’s best to avoid activating Hibernate statistics in production. Retrace, on the other hand, can provide similar information for your production systems without degrading performance and presents statistics in an easy to understand graphical interface.
You can view and filter all performed SQL queries, get additional information about how often a query was executed and how long the average execution took.
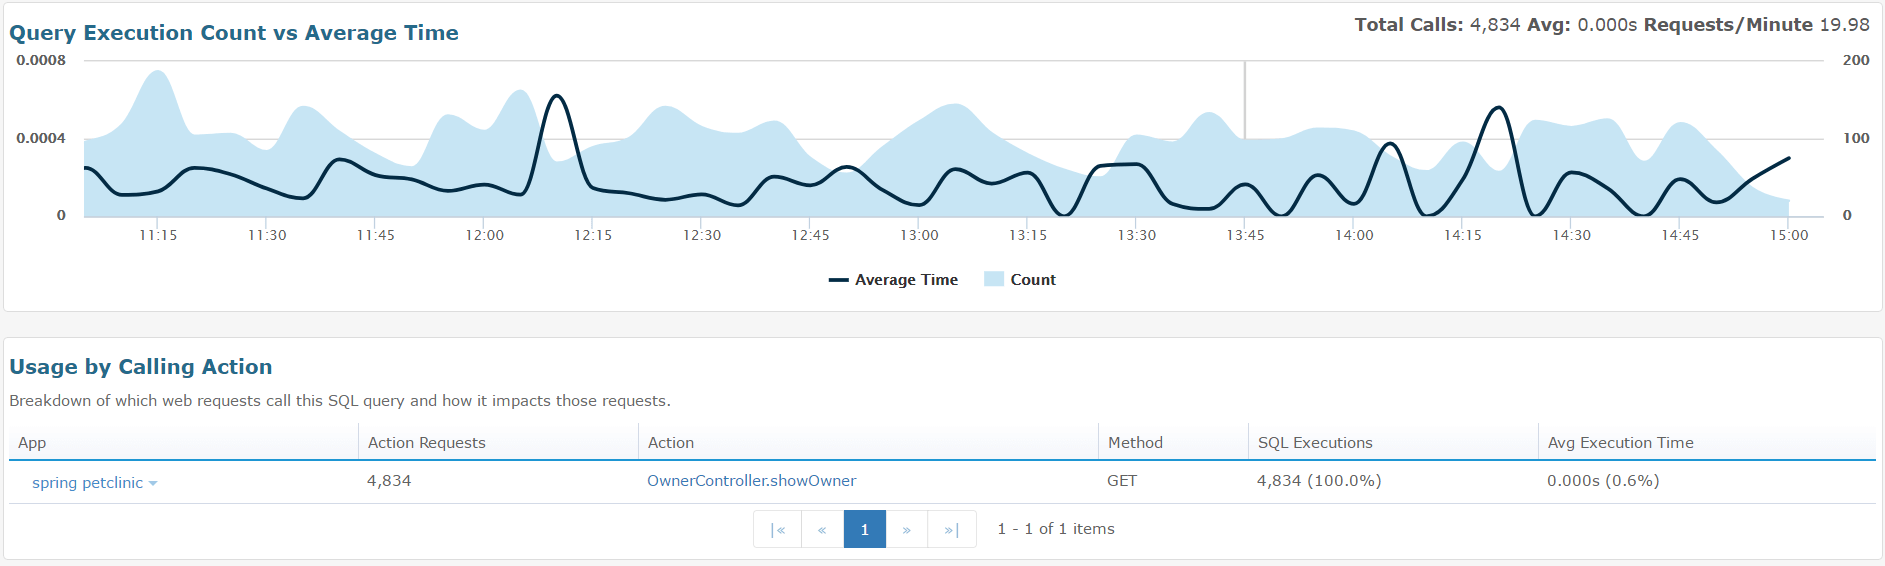
If you need more information about a specific query, you can click on it to get the average execution time and the execution count over time. You can also see the web requests that triggered the SQL query.
We’ve mentioned different approaches to getting more information about Hibernate’s database interactions and identifying potential performance issues. But how do you find exactly where these problems are and quickly fix them?
There are two groups of performance problems that you can easily spot with Hibernate’s additional log messages or with Retrace. The first group contains all problems that are caused by slow SQL queries and the second group contains problems caused by too many SQL statements.
Let’s begin with the first group.
Analyzing these kinds of problems requires a good understanding of your database and the tools it offers. If you have an experienced database administrator on your team, you should seek their help. Working together will most likely lead to more efficient and productive results.
If you followed the instructions at the beginning of this post, finding the slow queries comes easy. Hibernate and Retrace show you exactly how long the execution of a query took.
Improving the performance of these queries can be a lot more difficult. First, you need to find out why a query is slow. That’s where your database tools and the experience of your administrator are important.
In general, the performance problems are either caused by the database (e.g., outdated statistics or missing indices), or by an inefficient SQL statement.
You can’t do anything in your Java code to fix the internal database issues. Talk to your database administrator. They will know what you need to do.
Your database administrator can also help you analyze and improve your inefficient SQL queries. This fix will be to transform the optimized SQL query into a JPQL statement or execute it as a native SQL query.
Hibernate’s and JPA’s support for native SQL queries allows you to execute a plain SQL statement. You can do that by calling the createNativeQuery method of the EntityManager with your SQL statement. Hibernate doesn’t parse these statements, so you can use all standard and proprietary SQL features that are supported by your database.
Order o = (Order) em.createNativeQuery("SELECT * FROM purchase_order o WHERE id = 1", Order.class).getSingleResult();
Here is another common group of performance problems caused by too many queries. In contrast to the previous group, this one is only caused by Hibernate and how you use it. The solution is to fix it in your Java code.
The most common situation in which Hibernate performs a lot more queries than you might expect is called the n+1 select issue.
The n+1 select issue is probably the most popular Hibernate performance issue. It’s caused by the initialization of a lazy association between two entities. Let’s take a look at an example.
An order consists of multiple items. If you model that as entities, you get an Order entity with a lazy one-to-many association to the OrderItem entity.
The n+1 select issue occurs if you load multiple Order entities and iterate through them to call the getOrderItem method for each of them.
List orders = em.createQuery("SELECT o FROM Order o", Order.class).getResultList();
for (Order o : orders) {
	log.info("Order: "+o.getId() + " Num items: "+o.getItems().size());
}
When you execute this code, Hibernate performs 1 query to load n Order entities. It then has to execute another SQL statement for each Order entity to fetch the associated OrderItem entities. So in the end, Hibernate performs n+1 queries.
14:44:59,316 DEBUG SQL:92 - select items0_.fk_order as fk_order4_0_0_, items0_.id as id1_0_0_, items0_.id as id1_0_1_, items0_.name as name2_0_1_, items0_.fk_order as fk_order4_0_1_, items0_.version as version3_0_1_ from OrderItem items0_ where items0_.fk_order=?
14:44:59,334  INFO TestOrder:55 - Order: 1 Num items: 3
14:44:59,334 DEBUG SQL:92 - select items0_.fk_order as fk_order4_0_0_, items0_.id as id1_0_0_, items0_.id as id1_0_1_, items0_.name as name2_0_1_, items0_.fk_order as fk_order4_0_1_, items0_.version as version3_0_1_ from OrderItem items0_ where items0_.fk_order=?
14:44:59,337  INFO TestOrder:55 - Order: 2 Num items: 3
14:44:59,356  INFO StatisticalLoggingSessionEventListener:258 - Session Metrics {
    26126 nanoseconds spent acquiring 1 JDBC connections;
    21927 nanoseconds spent releasing 1 JDBC connections;
    427344 nanoseconds spent preparing 3 JDBC statements;
    2645707 nanoseconds spent executing 3 JDBC statements;
    0 nanoseconds spent executing 0 JDBC batches;
    0 nanoseconds spent performing 0 L2C puts;
    0 nanoseconds spent performing 0 L2C hits;
    0 nanoseconds spent performing 0 L2C misses;
    17105884 nanoseconds spent executing 1 flushes (flushing a total of 8 entities and 2 collections);
    67647 nanoseconds spent executing 1 partial-flushes (flushing a total of 0 entities and 0 collections)
}
Depending on the number of selected Order entities, Hibernate might need to execute a huge number of queries that significantly slow down your application.
This issue is easy to find. Hibernate’s session statistics and Retrace provide you with the number of queries that were executed within a given session. You then just need to analyze the executed queries and find the one that causes the n+1 select issue.
As soon as you’ve found the n+1 select issue culprit, you can fix the problem by telling Hibernate that it has to initialize the association when it loads the Order entity. You can do that with a JOIN FETCH clause in a JPQL query.
List orders = em.createQuery("SELECT DISTINCT o FROM Order o JOIN FETCH o.items", Order.class).getResultList();
As you can see in the log output, the JOIN FETCH clause changes the projection and adds a JOIN clause to the SQL statement. Hibernate now loads the Order entities and all associated OrderItem entities with one query.
14:47:12,121 DEBUG SQL:92 - select distinct order0_.id as id1_1_0_, items1_.id as id1_0_1_, order0_.version as version2_1_0_, items1_.name as name2_0_1_, items1_.fk_order as fk_order4_0_1_, items1_.version as version3_0_1_, items1_.fk_order as fk_order4_0_0__, items1_.id as id1_0_0__ from purchase_order order0_ inner join OrderItem items1_ on order0_.id=items1_.fk_order
14:47:12,183 DEBUG ConcurrentStatisticsImpl:387 - HHH000117: HQL: SELECT DISTINCT o FROM Order o JOIN FETCH o.items, time: 66ms, rows: 6
14:47:12,187  INFO TestOrder:71 - Order: 2 Num items: 3
14:47:12,187  INFO TestOrder:71 - Order: 1 Num items: 3
14:47:12,216  INFO StatisticalLoggingSessionEventListener:258 - Session Metrics {
    19594 nanoseconds spent acquiring 1 JDBC connections;
    58317 nanoseconds spent releasing 1 JDBC connections;
    244930 nanoseconds spent preparing 1 JDBC statements;
    1984630 nanoseconds spent executing 1 JDBC statements;
    0 nanoseconds spent executing 0 JDBC batches;
    0 nanoseconds spent performing 0 L2C puts;
    0 nanoseconds spent performing 0 L2C hits;
    0 nanoseconds spent performing 0 L2C misses;
    23932655 nanoseconds spent executing 1 flushes (flushing a total of 8 entities and 2 collections);
    76044 nanoseconds spent executing 1 partial-flushes (flushing a total of 0 entities and 0 collections)
}
The situations and scenarios above show how Retrace and Hibernate’s statistics can provide you with a lot of information about Hibernate’s database interactions. This information can help you to identify and fix performance problems during development, test and in production. But that is not all Retrace is about. Locating Hibernate performance issues is just a tip of the iceberg. Retrace is a handy APM tool for error tracking, real user monitoring, full transaction tracing and much more.
If you want to see how Retrace works, then you START YOUR FREE TRIAL TODAY!
Stackify's APM tools are used by thousands of .NET, Java, PHP, Node.js, Python, & Ruby developers all over the world.
Explore Retrace's product features to learn more.


