
Being a UI developer, I’ve learned one thing: It doesn’t matter how carefully you write your code. Suppose you’ve double-checked that you defined and called all functions the right way or followed all the best practices. Even then you’ll see that a tiny variable can sneak behind and create an error.
Now, suppose you find out that for some unknown reason a form validation or submit button isn’t working. Also, while going through the code, you’re unable to find the root cause of the error. Now, that’s really frustrating, isn’t it?
So what’s the solution to detect and fix the error? You guessed it right—debugging!
On that note, in this post, we’re going to discuss what debugging is and why we need it. We’ll also go over how to debug your JavaScript code using the browser’s developer console.

No matter how much experience you have, the JavaScript code that you’re writing may contain an error. If not syntactical, there’s a high chance that you’ll get a logical error in case of a complex app.
A frustrating thing is that often you won’t get an error message or any clue about where the error is happening. Debugging is the technique of searching for and fixing these unknown errors.
Debugging is done by forcing the code to stop running at a certain line. You can do that by setting a breakpoint. Once the code is paused, you can inspect and find out what’s wrong with the code. Wondering how to debug in the case of a JavaScript code? We’ll find out in the next section.
Back in the old days, Internet Explorer was the only king in the world of browsers. Developers didn’t have much choice to inspect the code during runtime. The only option to find an error was console.log or alert().
But currently, browsers like Chrome and Firefox provide a developer console. You can open your JavaScript code in the console, add breakpoints, and debug your code. Here, we’ll discuss how to debug your JavaScript code using Chrome’s developer console. So, let’s get started.
To understand how to debug your JavaScript code using Chrome, we have to get hands-on with code. I picked this code from JSFiddle. In the browser, you’ll see a box. As you press the up, down, left, and right keys, the box will move according to the key you pressed. The movement will also occur if you press W, A, S, and D. The code works fine. But in order to understand debugging in JavaScript, I’ll deliberately add some errors.
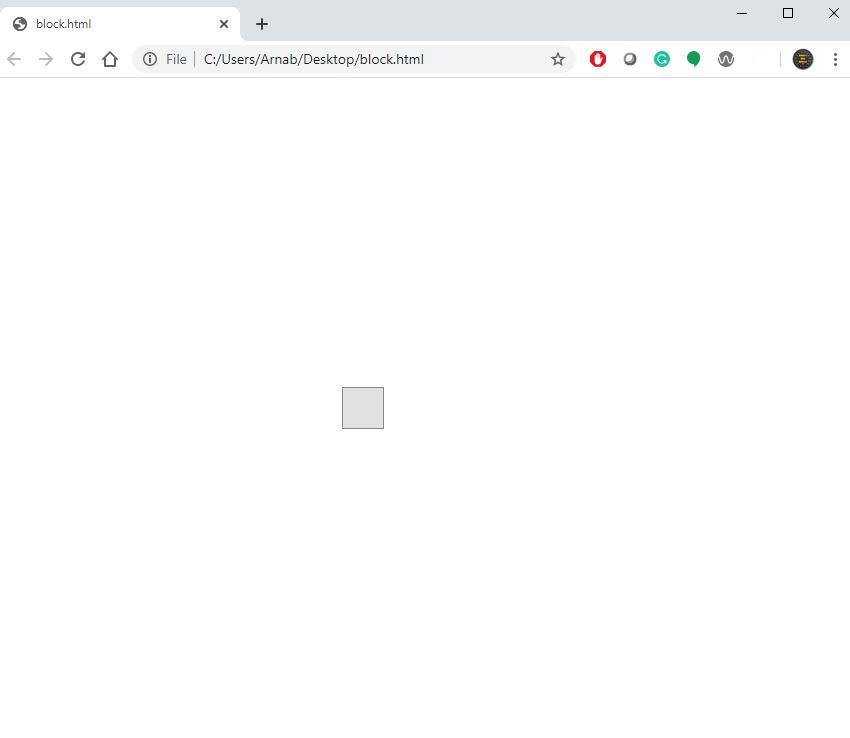
The very first problem I faced while running the code is, whatever key I press, the box is not moving. What to do now?
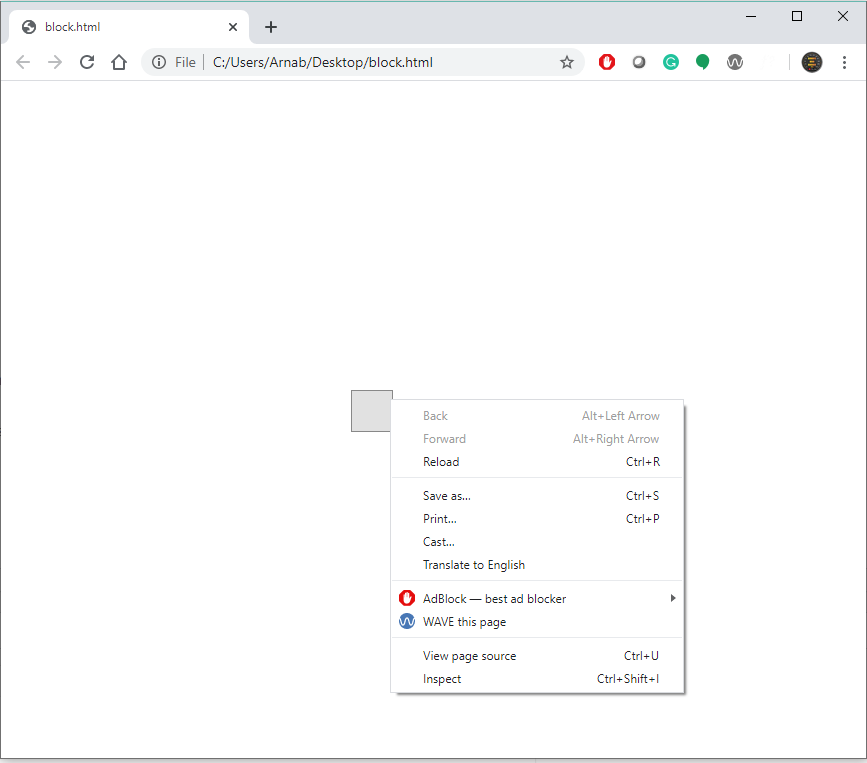
If you’re using Windows, you can press F12. You can also right-click on the box and select “inspect element.” This will open the developer console.
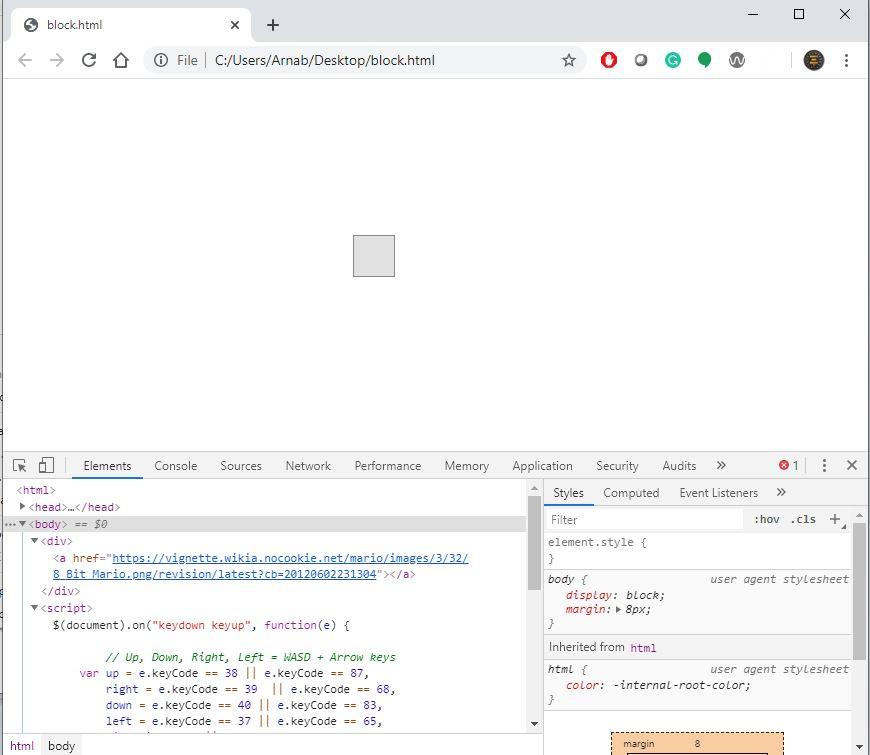
Firstly, click on the ‘Sources’ tab in the developer console. After that, click on the “pause” icon. This will enable the browser to stop code execution whenever there is an exception.

As soon as you do that, you’ll see that there’s an error in the following line of code:
$(document).on("keydown keyup", function(e) {
But what’s the error? Let’s hover on the line.
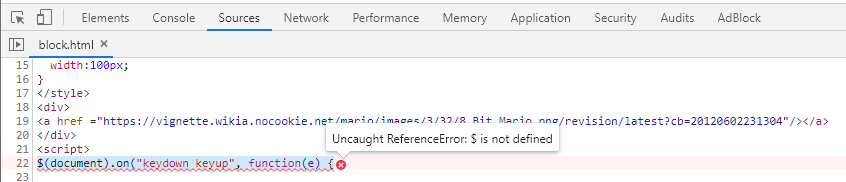
Well, no wonder the code wasn’t working. We’re using a jQuery syntax without adding the library. Let’s add the following code:
<script src="https://ajax.googleapis.com/ajax/libs/jquery/3.4.1/jquery.min.js"></script>
This script tag will allow the code to use the jQuery library. Now that you’ve added the library, the code is supposed to work fine. But when I run it on the browser and press the keys, I find out that A, S, D, left, down, and right are working fine. However, the “up” key is not working. Let’s find out what’s causing the error.
To do that, we need to add breakpoints. The breakpoint is an interesting feature of the debugger tool. It helps us figure out complex problems in the code. To set a breakpoint, you need to click on the line number where you want to add a breakpoint. This will add a debugger on that line. Once that’s done, run the code.
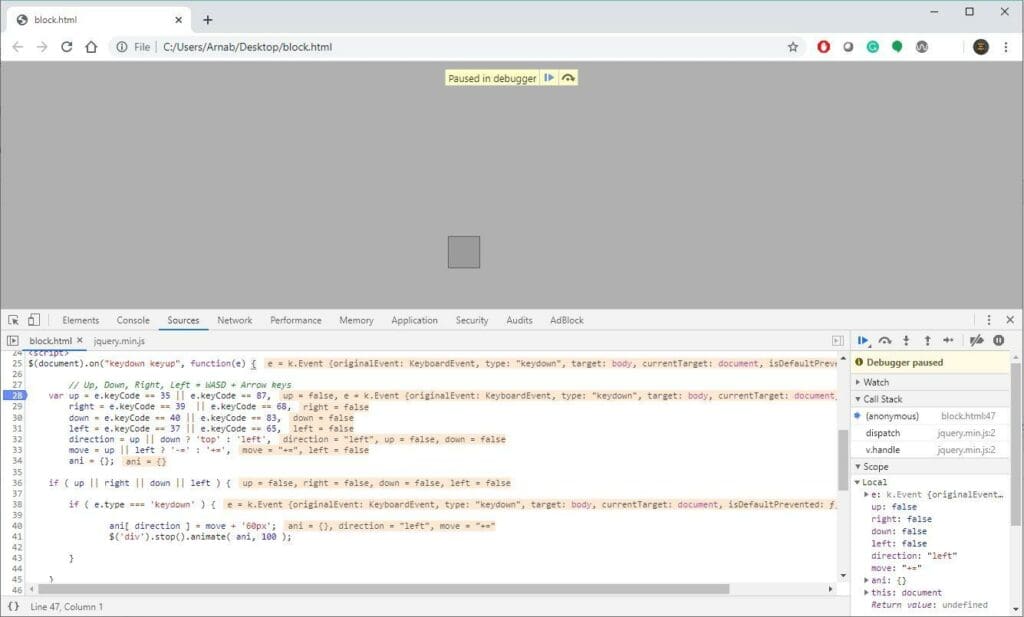
In our case, we’ll press a key and find out what’s happening:
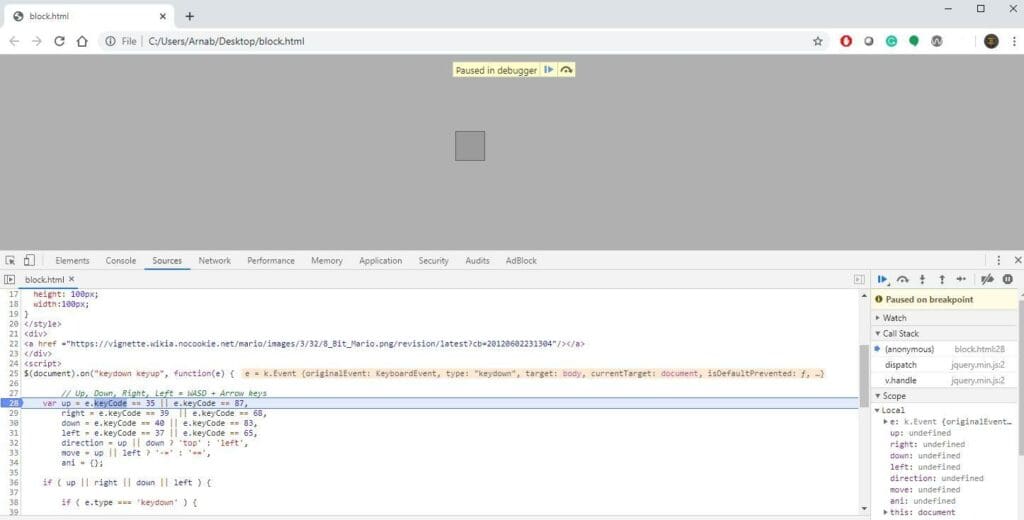
As you can see, the code execution paused at the breakpoint. Now we’ll move on to each line by pressing F10 and find out what’s happening on the backend.
An interesting feature of the debugger is that if you hover on each variable after the code has been executed, you’ll find out what data the variable carries in the backend.
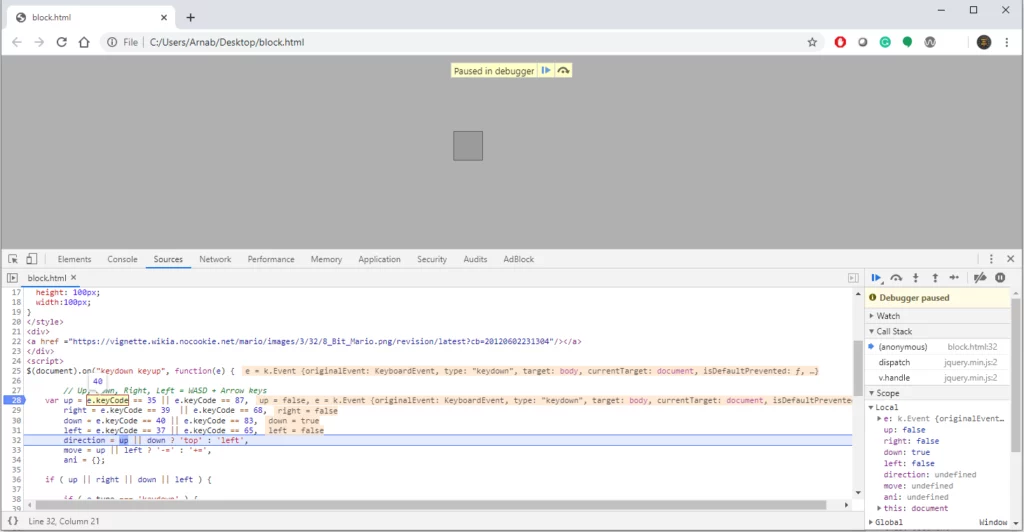
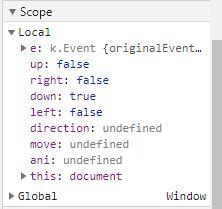
We pressed the “down” key on the keyboard. In the screenshot above, you can see that the code took the value of “keyCode” as 40. The JavaScript event key code of the “down” arrow is 40. The code got that right. So, in line number 40, you can see that while running the code, the browser finds “down” as true and the remaining as false. You can also find out the variable details in the “Scope” section on the right-hand side of the console. Since we declared the variables locally, they’re arranged under the local tab.
Now, let’s finish debugging.
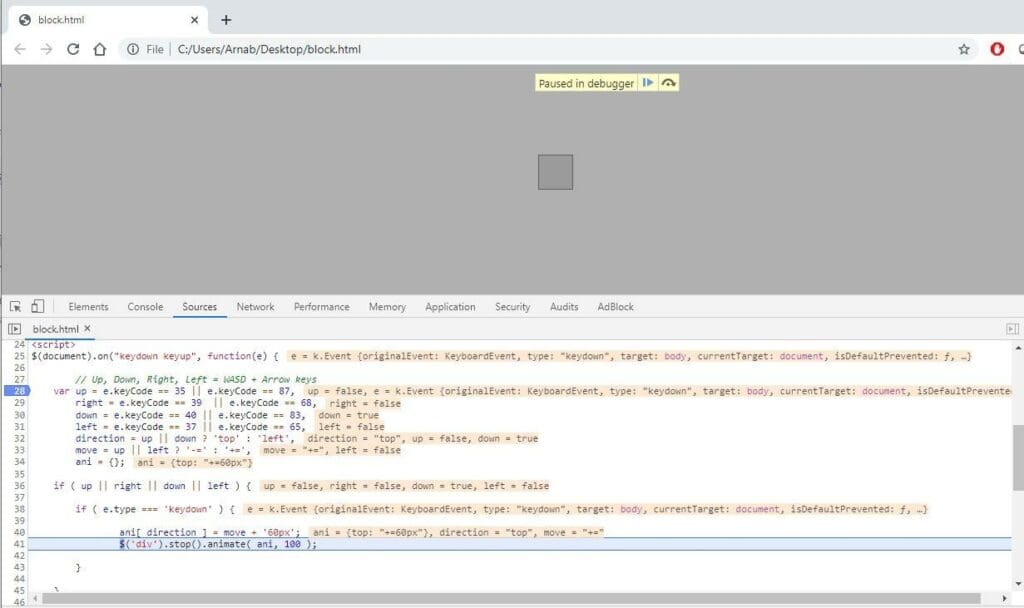
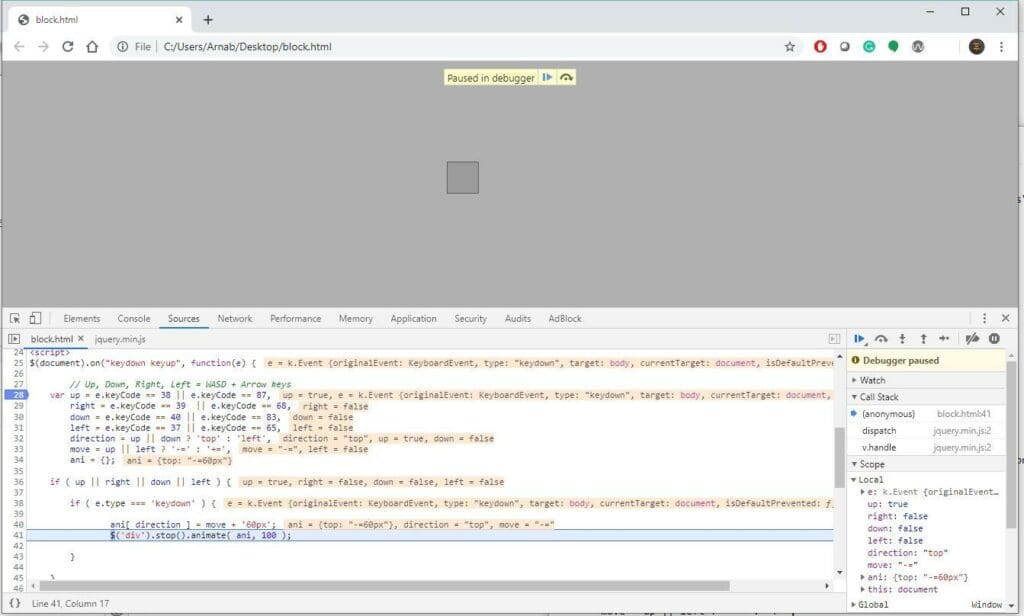
As per the code, since the down key is pressed, the box is supposed to move 60 pixels downwards. It just did. And in the final line –
$('div').stop().animate( ani, 100 );
The animation stopped just after execution.
So, all the keys are working fine. But what’s the problem with “up”? Let’s debug again.
As you can see, the “up” variable returned as false. But why? Let’s hover on the keyCode event.
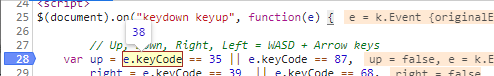
That’s it—I found my mistake. The event key code of “up” is 38, but in the code, I declared it as 35. Let’s correct it.
I finally did it. “Up” returned as true, and the functionality is working properly.
In case you’re trying to debug a complex function with multiple breakpoints, you can use F10 to switch from one breakpoint to the next.
Now that we know how to debug a JavaScript code using breakpoints, let’s discuss some other interesting features of the developer console.
To find and fix performance issues, developers frequently run commands in the “Console” tab.
No matter what browser you’re using, be it Chrome, Firefox, or even Edge, the debugging tool nowadays is powerful enough to reduce the time taken to detect an error. Just update your browser. You’ll find that there’s nothing more exciting than debugging your JavaScript code using the developer console.
As human beings, we’re bound to make mistakes. Writing the code in a structured manner keeps the architecture simple. We can also break down complicated problems. But even experienced programmers or technical architects can’t visually check code and find out which line is causing the error.
There’s always a huge difference between theory and practice. Designing the code structure is theory. But executing the code in real time is practice. And while running the code, errors may occur that you didn’t anticipate before.
So, if you’re new to JavaScript, learn how to debug your code. And with these great debugging tools of Chrome and Firefox, who needs the old technique of putting a console.log() or an alert() after every line of code? So, start debugging and deliver error-free JavaScript code that’s ready for deployment in production.
Stackify's APM tools are used by thousands of .NET, Java, PHP, Node.js, Python, & Ruby developers all over the world.
Explore Retrace's product features to learn more.


