Exception handling tools with limited features often have a short lifetime. Thankfully, getting detailed exceptions with Retrace is a great choice for development teams, especially when compared to ELMAH. Let’s take a look.
Logging utility tools have been on the market for many years. One example is the go-to logging utility for ASP.NET, ELMAH. Catching exceptions that came up through the IIS response pipeline, ELMAH logs exceptions along with contextual information. ELMAH also puts a subpage on your site that you can visit to view logged exceptions, making it a great tool for catching, logging and viewing unhandled exceptions for monolithic ASP.NET applications. But now that we’ve moved to distributed application architectures, you and your IT team need a different feature set.
When you look for a logging tool to serve your diverse needs as a software developer tasked with maintaining systems, look no further than Retrace. More than just a table of errors, Retrace provides metrics, monitoring, tracing and log aggregation. You can also feed ELMAH logs, log4net and NLog sources into Retrace, just to name a few.
While you don’t have to completely bury ELMAH but are looking to move on to something like ASP.NET Core, or even for you polyglots out there, Retrace gets you a whole lot further!
ELMAH gives you a list of errors that you can scan visually. You’ve got to take it all in before you can really see what you need. Retrace, on the other hand, scans your errors and gives you graphs and metrics. With those visuals, you can focus on what’s important.
Since a picture is worth a thousand words, let’s look at what you get from Retrace:
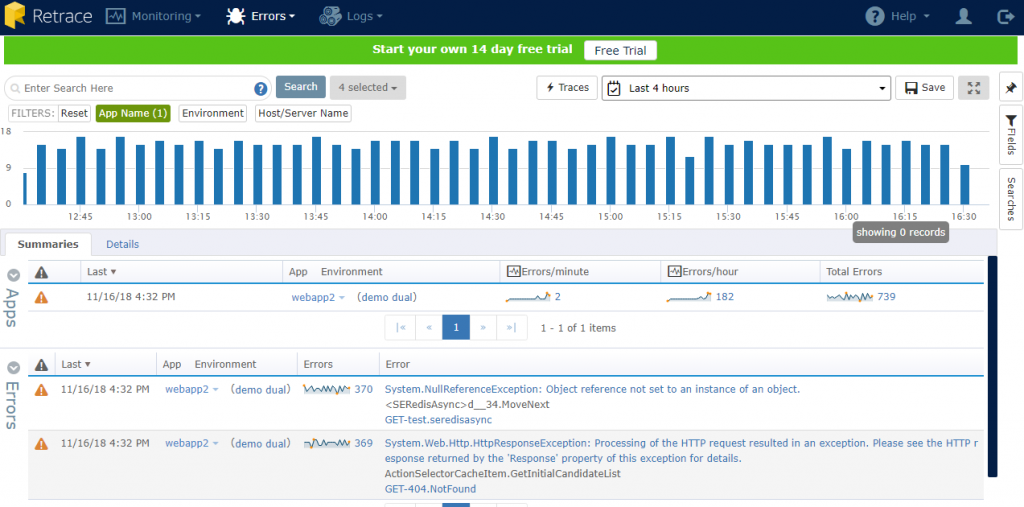
The Errors dashboard presents several breakdowns of the errors in the selected app. You can see the graph of errors for each interval in the last four hours, plus how many errors were logged per minute and per hour. The count of each type of error listed at the bottom and grouped together nicely so you aren’t scrolling through a long list.
Since you can send data to Retrace using so many logging clients, you have greater flexibility in the tools you use in your .NET apps. ELMAH isn’t automatically compatible with .NET Core, but other logging utilities are. For example, you can use this NuGet package to handle the configuration for .NET Core. NLog is ready to go by simply following the instructions on this GitHub wiki. And, of course, you can always send log entries to the REST endpoint.
Besides having the flexibility to use various logging utilities in .NET Standard and .NET Core, you can log to Retrace from various platforms, including Node.js, Java, PHP and Ruby. Theoretically, you can log from anything that has an HTTP client, and with Retrace, you get a whole lot more functionality.
In Retrace, you get much more contextual information than ELMAH, which provides some information about the server along with the stack trace and request information. What you don’t get is the surrounding context or the details about what happened “inside” the request.
From the Retrace Errors dashboard, you can look across applications to see what else was happening in your system around a specific application exception. Perhaps there was more than one application logging an error at the same time. This could indicate a network issue, a shared database issue, or something happening on a common dependency such as a shared API. From the dashboard, you would clearly see evidence of this type of issue.
Besides seeing multiple applications in one screen to provide context, you can also get more context around the specific call that had an issue. Another way Retrace gives you more context is by tracing automatically.
With Retrace, you can enable lightweight tracing to get much better detail. ELMAH doesn’t include an integrated APM solution along with the error logs, but Retrace does. Now when you have an error and you’ve got tracing, you can see what else was happening when the error occurred.
The tracing is automatic for the most common resources used in applications today – calls to SQL Server, Redis caches, DynamoDB and others. You benefit more from error logs when you combine them with tracing.
It’s best to see the difference for yourself, so here’s an example. The following image was taken from an error document, which contains all the information sent from the logging client. Here’s the part about the web request itself:
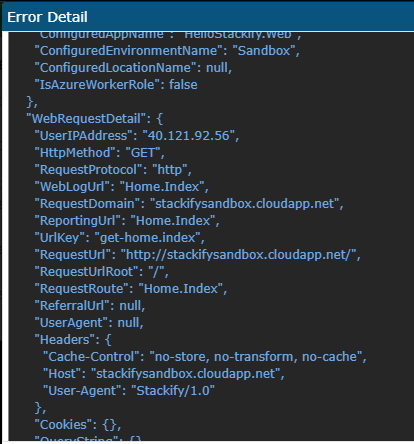
We know from the web request that this error came from the index route, but we don’t get the full picture.
Here’s the same error in the trace log:
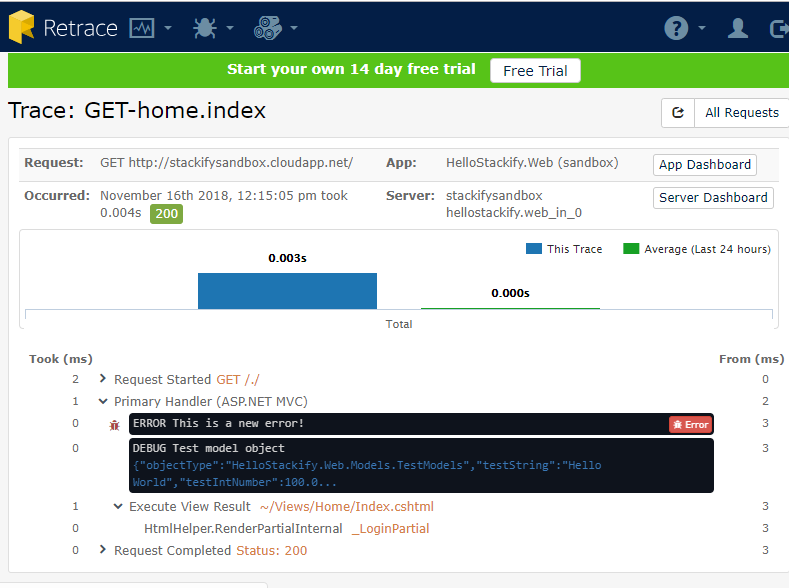
As you can see, the server responded to the user as if everything was okay. However, there was an error during the request. With this information, you might even find problems you didn’t even know you had! This is where performance monitoring really comes into play.
It’s one thing to see errors and stack traces, but those only give us one small piece of the picture that the users see. Errors only tell us when something is wrong and an exception was thrown. But we miss a lot when we’re just looking at those kinds of issues. There are other questions to consider, such as what happens when a page stalls. Moreover, what about when a specific component takes forever to load?
From the user experience perspective, these are issues, too. While these issues may not result in a blue screen of death or an error response, the failures still impact the user experience.
When you’re measuring application performance, you’re usually looking at things like HTTP response time. That’s the first line of defense. And yes, you can get this information directly from the server logs. But what happens when you do find a slow request? What steps do you take to dig further into understanding the underlying issues?
There are various questions you might ask at this point: Was it a specific SQL call? Was it page generation? Was it a concurrency issue? How about server resource utilization at the time? You could go out to various resources to answer some of these questions, but that would take a long time. You won’t answer all these questions unless you’re prepared. We’ve already seen that tracing gives us more information around the request. Now let’s see how it helps discover issues with resource timing.
Here’s a sample of a web request that took more than 200 seconds:
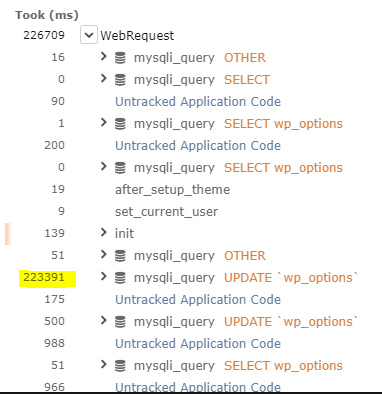
You wouldn’t expect a user to wait around that long before they refresh the page. With the trace view, you can see exactly how much each operation contributed to the poor response time. In this case, you can see that the MySQL query was the main culprit. And from this point, you can probably attribute the response time to a deadlock.
One of the best features in Retrace, especially for product managers, is the comprehensive dashboard. Retrace isn’t just a tool for techs to see errors. Retrace is about getting the most out of your application by giving you real insights about your application that you can use for planning.
The Retrace dashboard view displays all this information in one place, giving you instant visuals on server health, application performance and of course, errors. Retrace even gives you a letter grade on your application performance along with tips to improve your score!
Although ELMAH is a simple, effective solution to logging errors in single ASP.NET web apps, it has its limitations. Use Retrace to send logs instead and enjoy a solution that gives you better features and metrics.
If you’re still on the fence about Retrace, you can give it a try with zero commitment by signing up for a free 14-day trial. Once you do, you may be ready to let ELMAH go for good.
Stackify's APM tools are used by thousands of .NET, Java, PHP, Node.js, Python, & Ruby developers all over the world.
Explore Retrace's product features to learn more.


