One of the core benefits of Java is the JVM, which is an out-of-the-box memory management. Essentially, we can create objects and the Java Garbage Collector will take care of allocating and freeing up memory for us.
Nevertheless, memory leaks can still occur in Java applications.
In this article, we’re going to describe the most common memory leaks, understand their causes, and look at a few techniques to detect/avoid them. We’re also going to use the Java YourKit profiler throughout the article, to analyze the state of our memory at runtime.
The standard definition of a memory leak is a scenario that occurs when objects are no longer being used by the application, but the Garbage Collector is unable to remove them from working memory – because they’re still being referenced. As a result, the application consumes more and more resources – which eventually leads to a fatal OutOfMemoryError.
For a better understanding of the concept, here’s a simple visual representation:
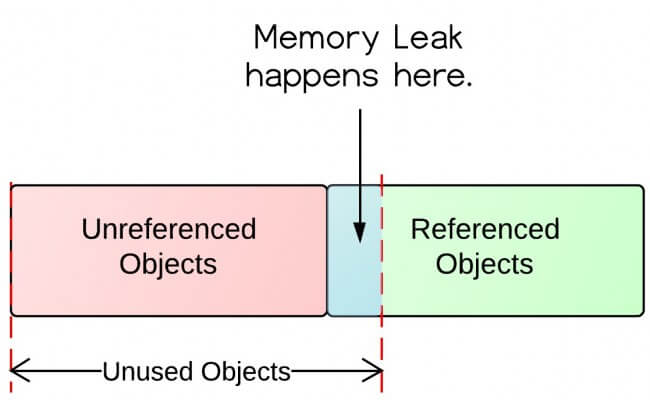
As we can see, we have two types of objects – referenced and unreferenced; the Garbage Collector can remove objects that are unreferenced. Referenced objects won’t be collected, even if they’re actually not longer used by the application.
Detecting memory leaks can be difficult. A number of tools perform static analysis to determine potential leaks, but these techniques aren’t perfect because the most important aspect is the actual runtime behavior of the running system.
So, let’s have a focused look at some of the standard practices of preventing memory leaks, by analyzing some common scenarios.
In this initial section, we’re going to focus on the classic memory leak scenario – where Java objects are continuously created without being released.
An advantageous technique to understand these situations is to make reproducing a memory leak easier by setting a lower size for the Heap. That’s why, when starting our application, we can adjust the JVM to suit our memory needs:
-Xms<size>
-Xmx<size>
These parameters specify the initial Java Heap size as well as the maximum Heap size.
The first scenario that might cause a Java memory leak is referencing a heavy object with a static field.
Let’s have a look at a quick example:
private Random random = new Random();
public static final ArrayList<Double> list = new ArrayList<Double>(1000000);

@Test
public void givenStaticField_whenLotsOfOperations_thenMemoryLeak() throws InterruptedException {
    for (int i = 0; i < 1000000; i++) {
        list.add(random.nextDouble());
    }

    System.gc();
    Thread.sleep(10000); // to allow GC do its job
}
We created our ArrayList as a static field – which will never be collected by the JVM Garbage Collector during the lifetime of the JVM process, even after the calculations it was used for are done. We also invoked Thread.sleep(10000) to allow the GC to perform a full collection and try to reclaim everything that can be reclaimed.
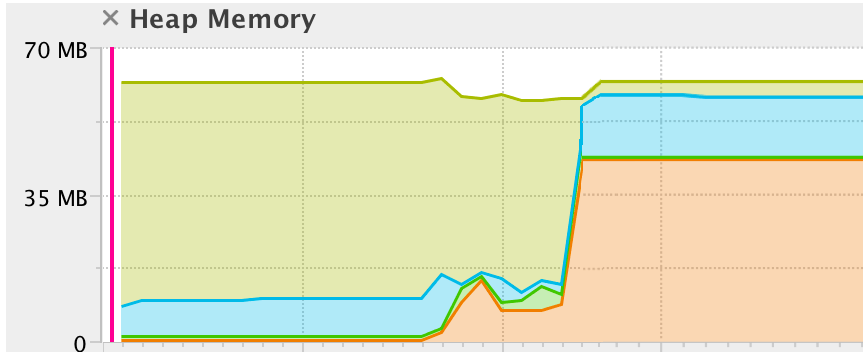
Let’s run the test and analyze the JVM with our profiler:
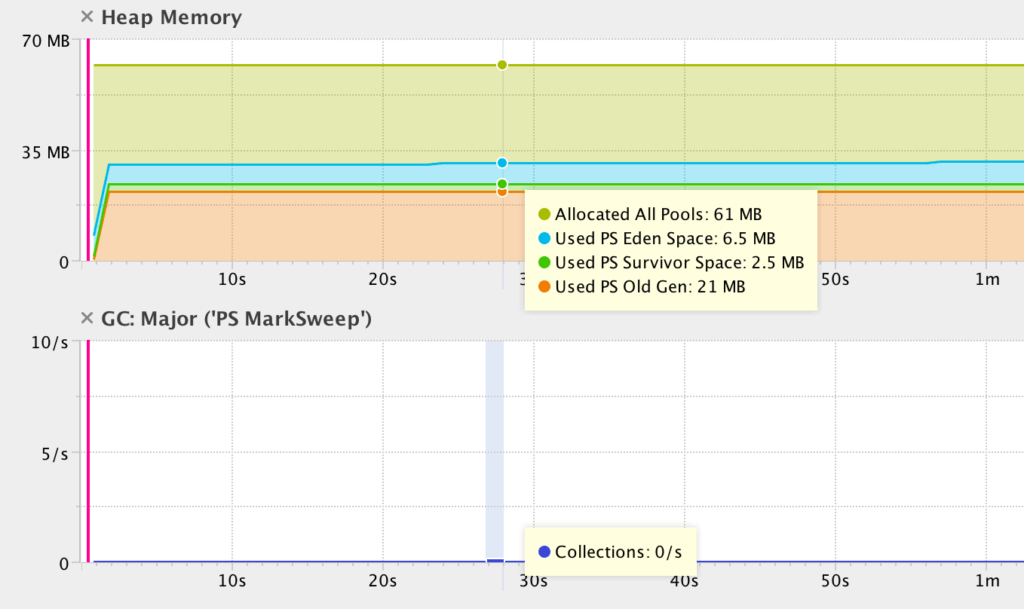
Notice how, at the very beginning, all memory is, of course, free.
Then, in just 2 seconds, the iteration process runs and finishes – loading everything into the list (naturally this will depend on the machine you’re running the test on).
After that, a full garbage collection cycle is triggered, and the test continues to execute, to allow this cycle time to run and finish. As you can see, the list is not reclaimed and the memory consumption doesn’t go down.
Let’s now see the exact same example, only this time, the ArrayList isn’t referenced by a static variable. Instead, it’s a local variable that gets created, used and then discarded:
@Test
public void givenNormalField_whenLotsOfOperations_thenGCWorksFine() throws InterruptedException {
    addElementsToTheList();
    System.gc();
    Thread.sleep(10000); // to allow GC do its job
}

private void addElementsToTheList(){
    ArrayList<Double> list = new ArrayList<Double>(1000000);
    for (int i = 0; i < 1000000; i++) {
        list.add(random.nextDouble());
    }
}
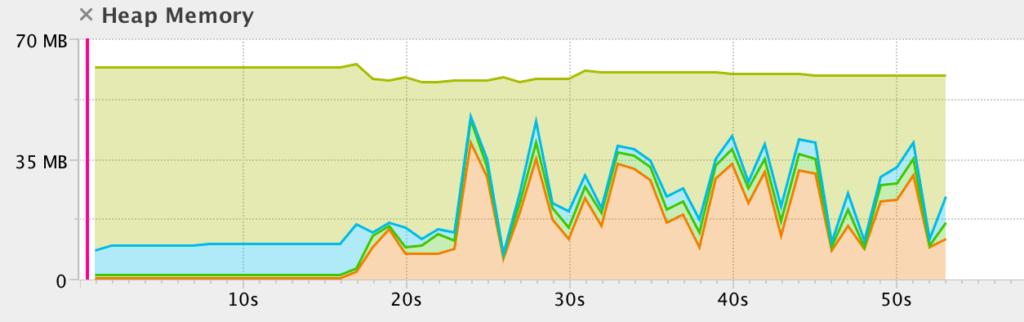
Once the method finishes its job, we’ll observe the major GC collection, around 50th second on the image below:
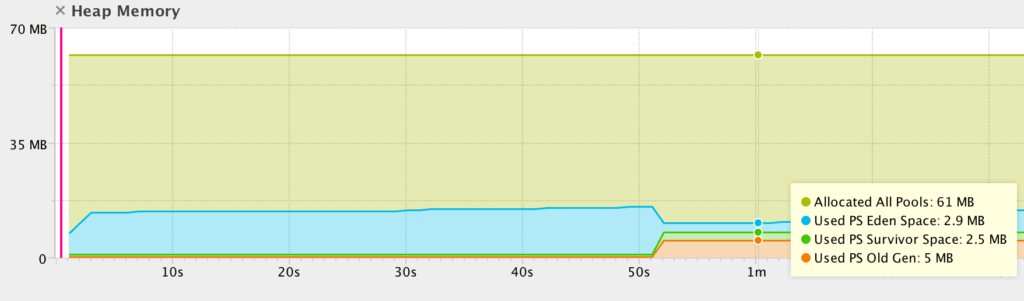
Notice how the GC is now able to reclaim some of the memory utilized by the JVM.
Now that you understand the scenario, there are of course ways to prevent it from occurring.
First, we need to pay close attention to our usage of static; declaring any collection or heavy object as static ties its lifecycle to the lifecycle of the JVM itself, and makes the entire object graph impossible to collect.
We also need to be aware of collections in general – that’s a common way to unintentionally hold on to references for longer than we need to.
The second group of scenarios that frequently causes memory leaks involves String operations – specifically the String.intern() API.
Let’s have a look at a quick example:
@Test
public void givenLengthString_whenIntern_thenOutOfMemory()
  throws IOException, InterruptedException {
    Thread.sleep(15000);

    String str
      = new Scanner(new File("src/test/resources/large.txt"), "UTF-8")
      .useDelimiter("\\A").next();
    str.intern();

    System.gc();
    Thread.sleep(15000);
}
Here, we simply try to load a large text file into running memory and then return a canonical form, using .intern().
The intern API will place the str String in the JVM memory pool – where it can’t be collected – and again, this will cause the GC to be unable to free up enough memory:
We can clearly see that in the first 15th seconds JVM is stable, then we load the file and JVM perform garbage collection (20th second).
Finally, the str.intern() is invoked, which leads to the memory leak – the stable line indicating high heap memory usage, which will never be released.
Please remember that interned String objects are stored in PermGen space – if our application is intended to perform a lot of operations on large strings, we might need to increase the size of the permanent generation:
-XX:MaxPermSize=<size>
The second solution is to use Java 8 – where the PermGen space is replaced by the Metaspace – which won’t lead to any OutOfMemoryError when using intern on Strings:
Finally, there are also several options of avoiding the .intern() API on Strings as well.
Forgetting to close a stream is a very common scenario, and certainly, one that most developers can relate to. The problem was partially removed in Java 7 when the ability to automatically close all types of streams was introduced into the try-with-resource clause.
Why partially? Because the try-with-resources syntax is optional:
@Test(expected = OutOfMemoryError.class)
public void givenURL_whenUnclosedStream_thenOutOfMemory()
  throws IOException, URISyntaxException {
    String str = "";
    URLConnection conn
      = new URL("http://norvig.com/big.txt").openConnection();
    BufferedReader br = new BufferedReader(
      new InputStreamReader(conn.getInputStream(), StandardCharsets.UTF_8));

    while (br.readLine() != null) {
        str += br.readLine();
    }

    //
}
Let’s see how the memory of the application looks when loading a large file from an URL:
As we can see, the heap usage is gradually increasing over time – which is the direct impact of the memory leak caused by not closing the stream.
Let’s dig a bit deeper into this scenario because it’s not as clear-cut as the rest. Technically, an unclosed stream will result in two types of leaks – a low-level resource leak and memory leak.
The low-level resource leak is simply the leak of an OS-level resource – such as file descriptors, open connections, etc. These resources can also leak, just like memory does.
Of course, the JVM uses memory to keep track of these underlying resources as well, which is why this also results in a memory leak.
We always need to remember to close streams manually, or to make a use of the auto-close feature introduced in Java 8:
try (BufferedReader br = new BufferedReader(
  new InputStreamReader(conn.getInputStream(), StandardCharsets.UTF_8))) {
    // further implementation
} catch (IOException e) {
    e.printStackTrace();
}
In this case, the BufferedReader will be automatically closed at the end of the try statement, without the need to close it in an explicit finally block.
This scenario is quite similar to the previous one, with the primary difference of dealing with unclosed connections (e.g. to a database, to an FTP server, etc.). Again, improper implementation can do a lot of harm, leading to memory problems.
Let’s see a quick example:
@Test(expected = OutOfMemoryError.class)
public void givenConnection_whenUnclosed_thenOutOfMemory()
  throws IOException, URISyntaxException {

    URL url = new URL("ftp://speedtest.tele2.net");
    URLConnection urlc = url.openConnection();
    InputStream is = urlc.getInputStream();
    String str = "";

    //
}
The URLConnection remains open, and the result is, predictably, a memory leak:
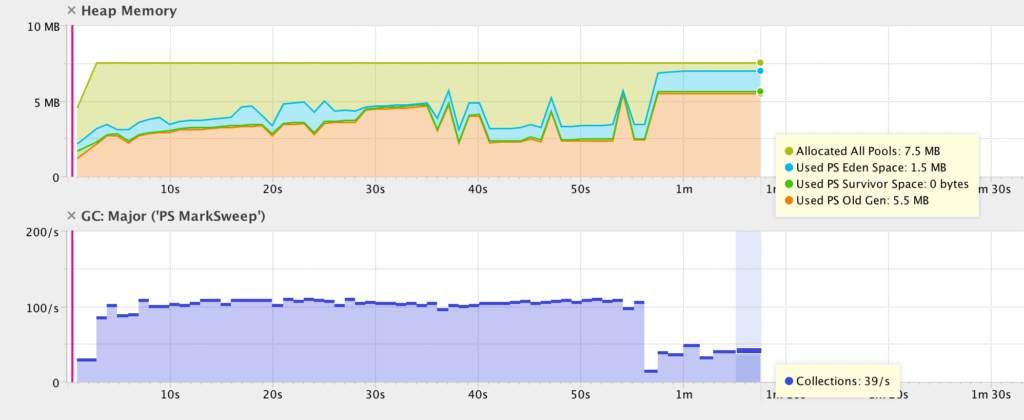
Notice how the Garbage Collector cannot do anything to release unused, but referenced memory. The situation is immediately clear after the 1st minute – the number of GC operations rapidly decreases, causing increased Heap memory use, which leads to the OutOfMemoryError.
The answer here is simple – we need to always close connections in a disciplined manner.
A simple but very common example that can lead to a memory leak is to use a HashSet with objects that are missing their hashCode() or equals() implementations.
Specifically, when we start adding duplicate objects into a Set – this will only ever grow, instead of ignoring duplicates as it should. We also won’t be able to remove these objects, once added.
Let’s create a simple class without either equals or hashCode:
public class Key {
    public String key;

    public Key(String key) {
        Key.key = key;
    }
}
Now, let’s see the scenario:
@Test(expected = OutOfMemoryError.class)
public void givenMap_whenNoEqualsNoHashCodeMethods_thenOutOfMemory()
  throws IOException, URISyntaxException {
    Map<Object, Object> map = System.getProperties();
    while (true) {
        map.put(new Key("key"), "value");
    }
}
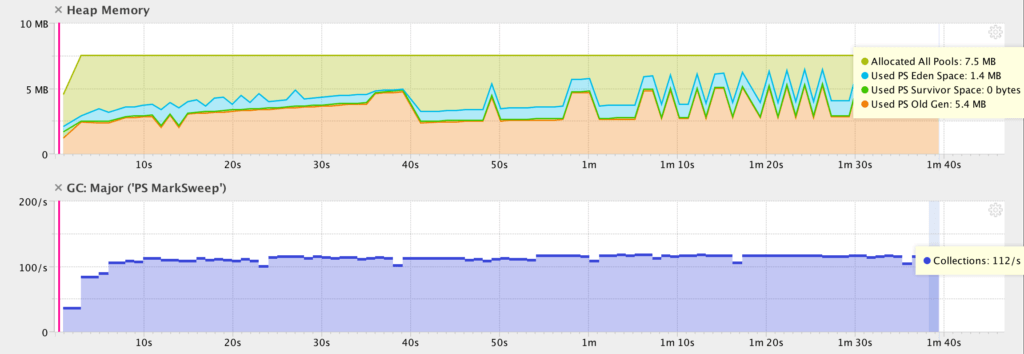
This simple implementation will lead to the following scenario at runtime:
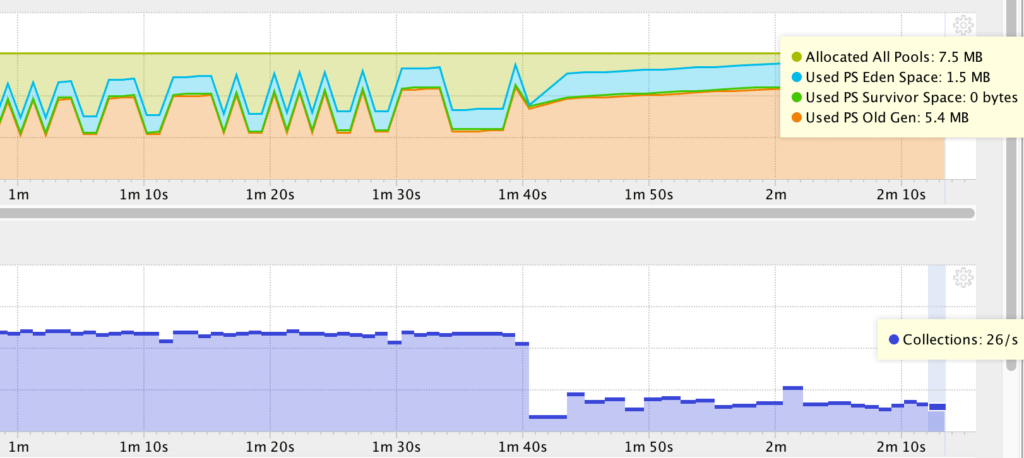
Notice how the garbage collector stopped being able to reclaim memory around 1:40, and notice the memory leak; the number of GC collections dropped almost four times immediately after.
In these situations, the solution is simple – it’s crucial to provide the hashCode() and equals() implementations.
One tool worth mentioning here is Project Lombok – this provides a lot of default implementation by annotations, e.g. @EqualsAndHashCode.
Diagnosing memory leaks is a lengthy process that requires a lot of practical experience, debugging skills and detailed knowledge of the application.
Let’s see which techniques can help you in addition to standard profiling.
One of the quickest ways to identify a memory leak is to enable verbose garbage collection.
By adding the -verbose:gc parameter to the JVM configuration of our application, we’re enabling a very detailed trace of GC. Summary reports are shown in default error output file, which should help you understand how your memory is being managed.
The second technique is the one we’ve been using throughout this article – and that’s profiling. The most popular profiler is Visual VM – which is a good place to start moving past command-line JDK tools and into lightweight profiling.
In this article, we used another profiler – YourKit – which has some additional, more advanced features compared to Visual VM.
Finally, this is more of a general good practice than a specific technique to deal with memory leaks.
Simply put – review your code thoroughly, practice regular code reviews and make good use of static analysis tools to help you understand your code and your system.
In this tutorial, we had a practical look at how memory leaks happen on the JVM. Understanding how these scenarios happen is the first step in the process of dealing with them.
Then, having the techniques and tools to really see what’s happening at runtime, as the leak occurs, is critical as well. Static analysis and careful code-focused reviews can only do so much, and – at the end of the day – it’s the runtime that will show you the more complex leaks that aren’t immediately identifiable in the code.
Finally, leaks can be notoriously hard to find and reproduce because many of them only happen under intense load, which generally happens in production. This is where you need to go beyond code-level analysis and work on two main aspects – reproduction and early detection.
The best and most reliable way to reproduce memory leaks is to simulate the usage patterns of a production environment as close as possible, with the help of a good suite of performance tests.
And early detection is where a solid performance management solution and even an early detection solution can make a significant difference, as it’s the only way to have the necessary insight into the runtime of your application in production.
The full implementation of this tutorial can be found over on GitHub. This is a Maven based project, so it can simply be imported and run as it is.
Stackify's APM tools are used by thousands of .NET, Java, PHP, Node.js, Python, & Ruby developers all over the world.
Explore Retrace's product features to learn more.


