
Almost every ASP.NET application uses some sort of database. But from my experience, the reporting of how long SQL queries take is wildly inaccurate. In this article I’m going to explain why, and show you how you can see the real amount of time that your queries take. This article is really specific to Microsoft SQL Server but the principle applies universally to any database queries.
SQL query times have the same problem that web server response times have. The amount of time it takes a web server to render a page is way different than how long it takes a web browser to download and render it. SQL queries have the same exact sort of problem. It could take a database server 50ms to run a query, but it could take your code 500ms to download and iterate through the results.
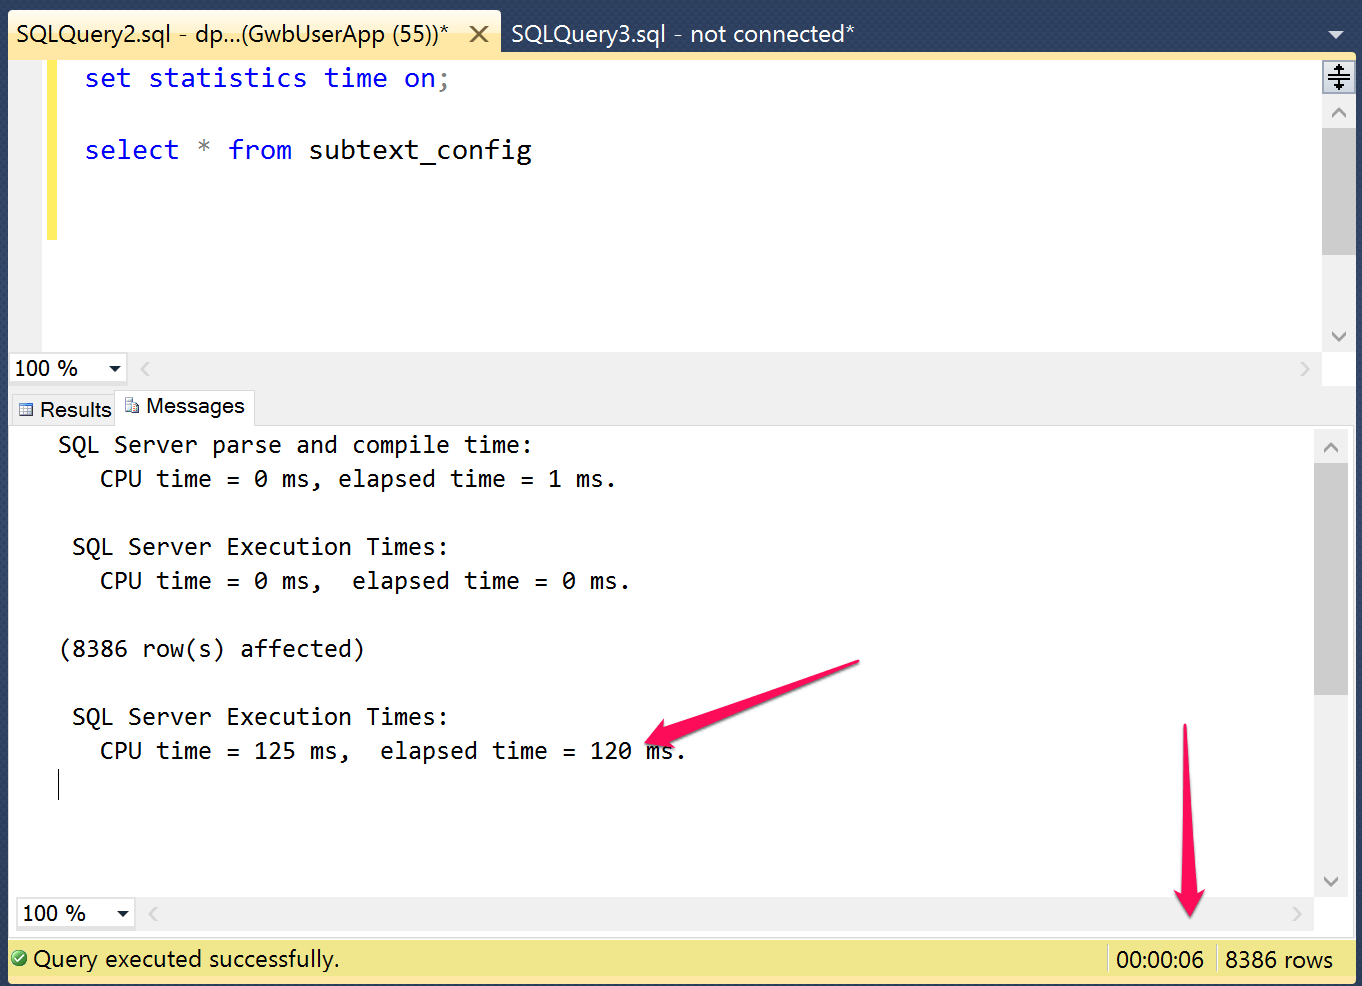
Here is our code and query being used for this example:
This simple query returns 8386 rows from a database and is 4.7MB of total data that has to be downloaded from the server. As you can imagine, it takes a lot longer to retrieve that data than it does for your database server to execute the query plan.
If I run the query in SQL Management Studio and I can already see a big conflict. By turning time statistics on, I can see SQL says it took 125ms to execute the query. But you can also see that it shows it took 6 seconds to fully execute the query.
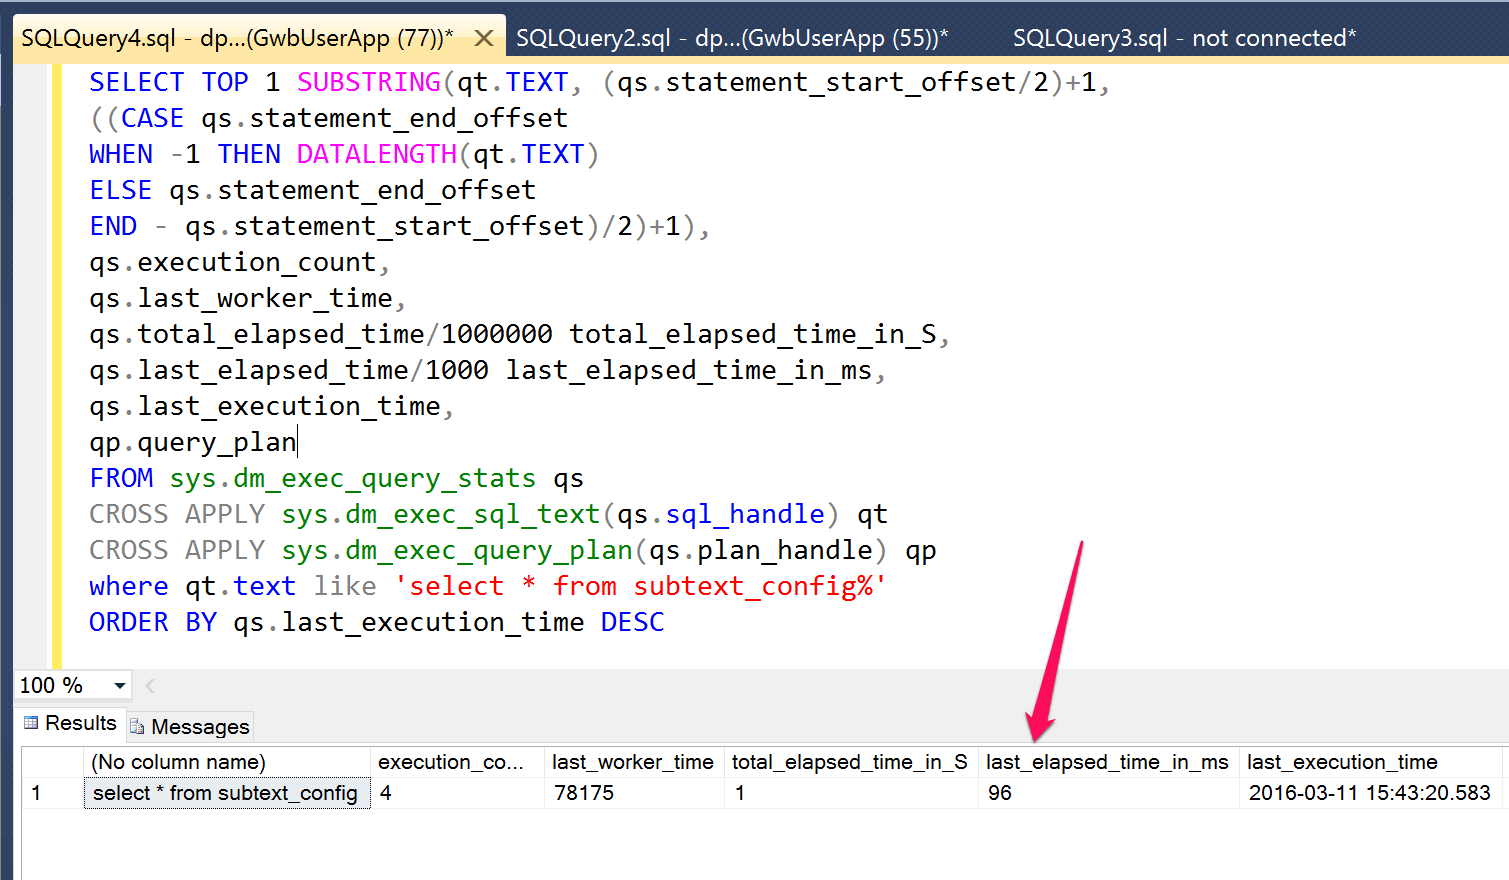
SQL DMV’s are also misleading… We all commonly rely on SQL Server to tell us how long our queries are taking. But you can quickly see that it only knows how long it took to execute the query, not how long it took to consume it. I have ran the query a few times so it doesn’t exactly match my screenshot above, but you can see in this DMV query below it only shows 96 milliseconds, a big difference from the real world of 6 seconds.
So how do we actually track how long it really takes to run a query? We have proven that SQL’s built in reporting isn’t fool proof. For queries that don’t return much data, it is probably pretty accurate. However, for queries that return a lot of records or multiple results sets, the real world impact to performance can be very different. So how do we track the actual impact of queries on our apps and our users? Prefix is a free tool that ASP.NET developers can use to see what SQL queries their apps are running, and it does a good job of showing this exact problem.
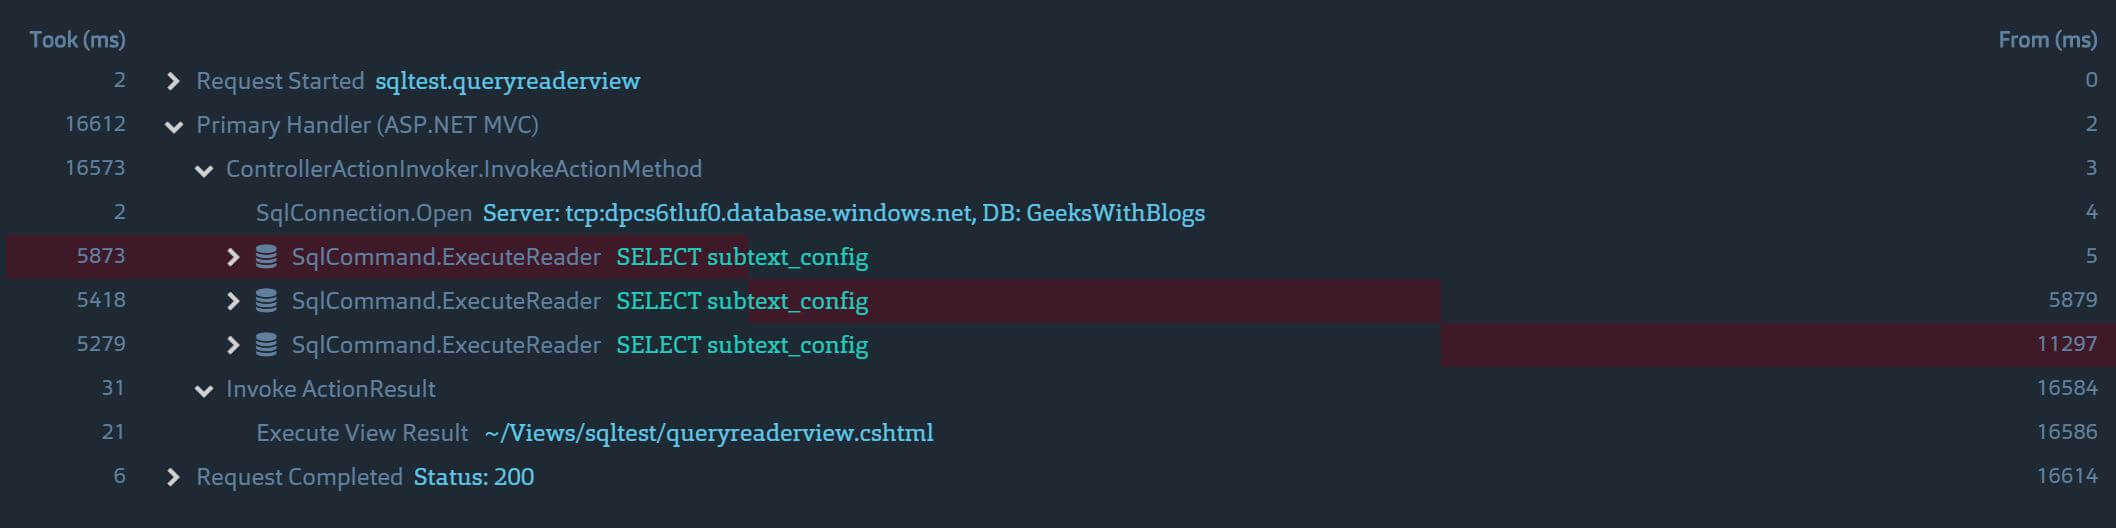
This screenshot from Prefix shows that the query took a total of 6117ms to run. It also shows that 5834ms of that was iterating and downloading the results. If you go back up and look at the code, it is just a simple DataReader iterating through the results.

The only way to really see real world performance of your queries in production is by using some sort of APM product that can track performance within your code. Prefix is an amazing free tool that developers can use to help find and understand these types and more performance problems. I highly recommend it. Stackify’s V3 of APM will also support this new ability to see the real world impact of SQL queries.
I did a quick test of the popular Glimpse tool to see what it would report. On the first try… it didn’t show anything. I had to change my code to use their special factory classes for my connection and command for it show anything at all. I set it up to run the query 3 times in a row to help illustrate the problem with Glimpse and similar tools. As you can see in the screenshots, it shows the duration of the queries based on the server execution time only. Their timeline view shows 3 dots where the queries happened. We now know all the rest of the time is from reading the query results, but that isn’t obvious at all and would be a mystery to most developers.

Prefix, on the other hand, makes it very obvious how much total time was spent for the three queries. It also didn’t require any sort of code or config changes to work.
The goal was to help stress how important it is to understand the real world performance of your SQL queries, and not just what your database reporting says. Much like web server response times, how long a browser takes to fully render a web page is very different than how long it takes a web server to render some basic HTML. To fully understand the real world performance you have to measure it from within your code. For production monitoring, your best bet is an APM product that can do this. For development purposes, I highly recommend checking out Prefix, which is free.
Stackify's APM tools are used by thousands of .NET, Java, PHP, Node.js, Python, & Ruby developers all over the world.
Explore Retrace's product features to learn more.


