
Today’s applications depend on a wide array of 3rd party and internal web services. Retrace’s web service monitoring capabilities have always been able to monitor how often your code accesses any type of HTTP web services over REST, SOAP, etc. This includes popular external services like Twilio, SendGrid, Amazon S3, or others. It also would include your own microservices.
We recently added even more functionality and detail around how we track the performance of HTTP web services that your application consumes.
Please Note: Some of the functionality below is dependent on the latest versions of the Retrace monitoring agents due to some data collection changes.
Retrace works by instrumenting and profiling your .NET, .NET Core, Java, Ruby, Node.js, Python and PHP code. It can detect every time your code makes an external HTTP request. Here are some examples of the types of services Retrace’s web service monitoring will detect and monitor for you.
For a complete list of what types of frameworks Retrace works with, please see our .NET, Java, and PHP docs.
Retrace now tracks the performance down to to the URL being accessed. In the past, we only tracked performance by the entire domain name being called. The more detailed reporting makes it easier to understand the performance of different HTTP operations.
Below is an example of the new application dashboard within Retrace. In this example, we can see the performance of Chargify and our Elasticsearch nodes. This view shows the top 5 but you can access all of them.
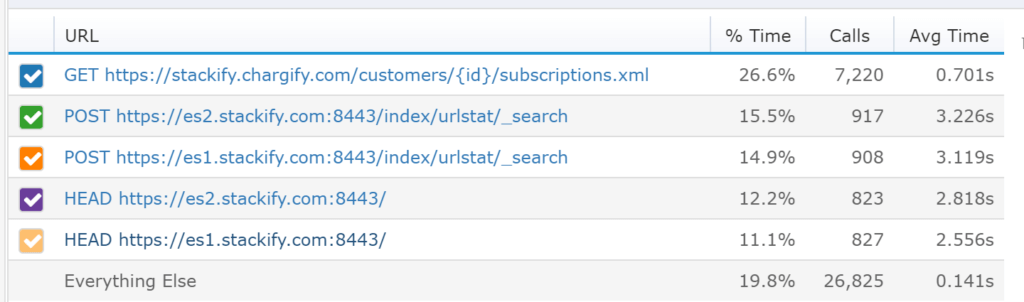
Retrace provides reporting to help you identify where in your code is making all of these web service calls. From our example above, we can see that Chargify is being called a crazy amount of times. By clicking on that URL we can dig into to learn more.
The screen below shows more details about how often the web service is called and how long it takes over time. We can also see a breakdown of all of the URLs or MVC actions within our software that are calling the web service. This helps us understand what it impacts and what is using it.

One of the best features of Retrace’s web service monitoring is the request traces it collects. They show a ton of details about what your code is doing. Including SQL queries, logging, HTTP web service calls and much more.
Within the context of a web request, you can see when the web service call was executed, how long it took and everything that happened just before and after it.
Developers are often surprised to see how many SQL queries and HTTP web service calls their code is making. The level of context and details that are collected make it significantly easier to find bugs and ways to optimize your code.
You can see the web service call highlighted below. As well as several Redis and SQL queries that were called. Sensitive details have been masked out.

If your application is calling one of your own web services, you can monitor the performance on both sides. You can see how long it takes from the code that is calling your web service. You can also track the performance of your web service itself.
This gives you end to end visibility of what your code is doing and how your applications are performing.
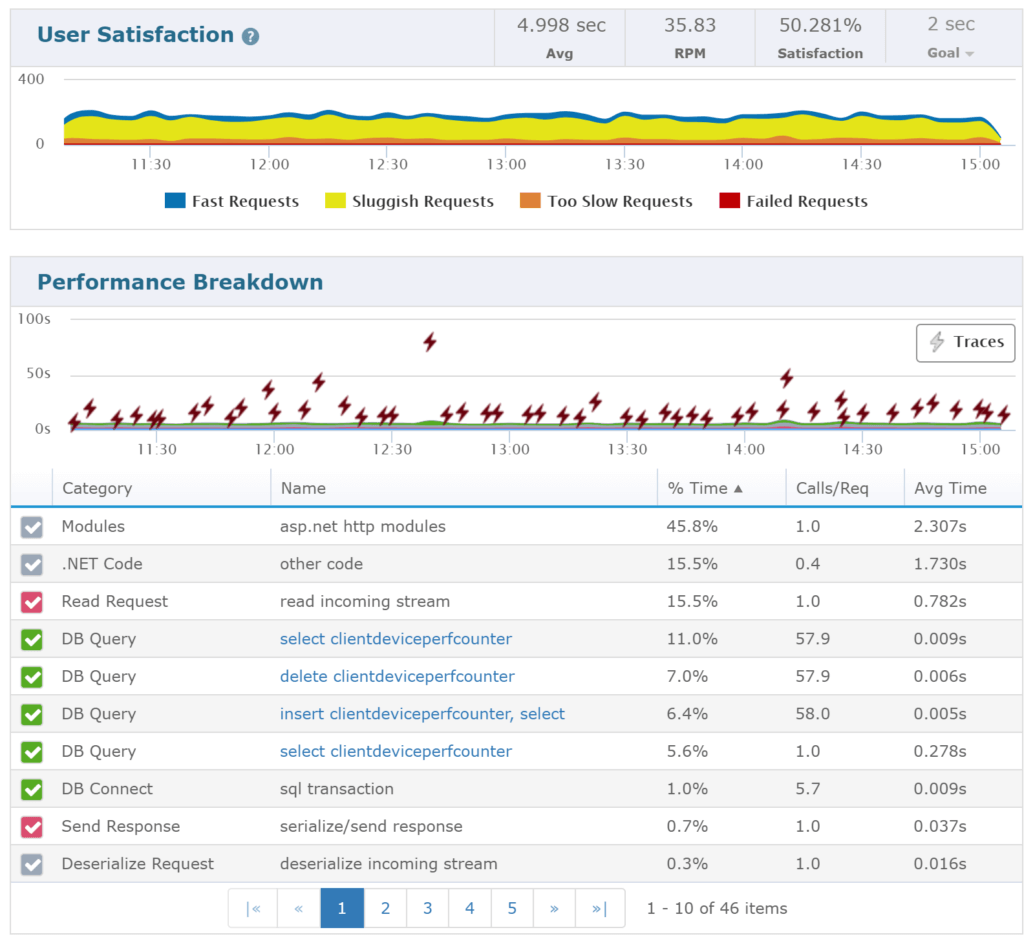
Retrace’s web service monitoring can tell you how your web service is performing and how often it is being called.
Quickly identify your requests per minute (RPM), request average, and calculated satisfaction score.
From the request below, you can see that it is pretty slow most of the time. The performance breakdown shows that it executes a lot of SQL statements that add up to a lot of time.
Retrace’s web service monitoring can help you track the performance of your .NET, PHP, Ruby, .NET Core, Node.js, Python and Java web services from end to end. Track what web services you are calling and how they impact the performance of your software. You can also break down the performance and usage of your own web services to monitor their performance and look for ways to optimize performance.
Stackify's APM tools are used by thousands of .NET, Java, PHP, Node.js, Python, & Ruby developers all over the world.
Explore Retrace's product features to learn more.


