
To all the PHP developers out there, it is highly advisable that every application you build should have the right PHP performance testing tools to ensure that it runs correctly. There are a variety of tools available that can monitor your application’s performance. Choosing the right tool that caters to your organization’s needs should be a priority.
In general, with the numerous languages used in building an application, please consider the comparison of different application & monitoring tools as a primer.
One of the best things about being a PHP developer is the vast resources and support such as its development tools. Here are some PHP performance testing tools you may want to consider in building your PHP application.
PHP profilers have been widely used by developers to improve PHP performance or to determine weak points of web applications. There are two types of code profilers: standard and tracing profilers.
Standard profilers periodically record stack traces of your application, while tracing profilers are lighter-weight than standard profiles and can be used while you code.
Standard code profilers give you a snapshot of important metrics like CPU, memory usage, time spent per line of code, and frequency of method calls.
On the other hand, tracing profilers have quite an advantage from standard as you can use it every day, and it won’t slow you down. It is designed to catch errors in real time while you’re developing, instead of catching errors after the fact. Tracing profilers are considered as your first line of defense in dealing with bugs.
Pros: A code profiler gathers information on the amount of memory and CPU usage. Optimization is crucial because web applications use server resources, and memory, CPUs, and disk storage are expensive. Standard profilers help you track down memory leaks and performance issues that are leading to high memory usage. If memory usage is a problem, standard profilers are the solution. On the other hand, tracing profilers can be used every day to catch errors while they happen. They allow developers to debug in any environment, even production. Most code profilers are completely free to use.
Cons: There are downsides to using profilers because it adds overhead to the server. But profilers are only meant to be used during development, which developers always do locally. Profilers can still be used in production to gather some insights on its performance, but the overall effect of the profiler is not debilitating to the entire application.
Popular Tools: Usage of these profilers differs from Xdebug and Xhprof. These are relatively easy to set up in a web server, while others require high technical skill. There are other PHP code profilers such as Z-ray and Prefix. Prefix from Stackify is a free lightweight profiler for developers.
It’s very important to track how a web application behaves in certain scenarios so that developers can optimize parts of the application that might be underperforming. It’s crucial to know which part of a web application slows down the entire application. In most cases, PHP performance bottlenecks happen during database queries and API calls because the application has to wait for these processes to complete before moving on to the next task. Retrace is one of the tools that can be used in performance monitoring. Here are some screen captures on how Retrace works.
Based on the data gathered by Retrace, this web application has multiple inserts and select queries that put a lot of load on the server. By analyzing these insert and select queries, the developers were able to pinpoint what’s causing the multiple inserts and select database queries. A possible solution like applying left joins in select queries also improved the performance of the web application.
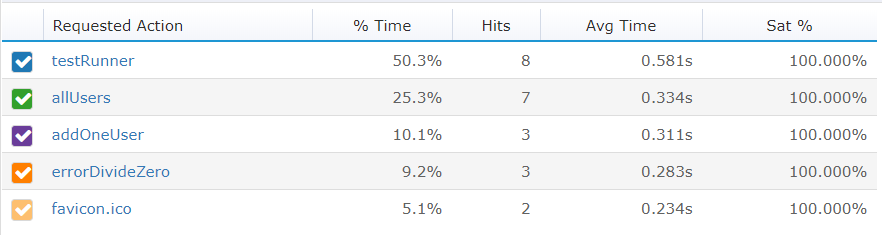
Also by using Retrace, developers will be able to see which pages or requests are the most active or loaded, and the average time it took to complete its processing. This is important to keep track which pages, queries, or requests need to be improved or optimized.
Pros: APM tools provide the broadest and deepest level of profiling. They track server, database, logs, web requests, and PHP performance to help you identify the slowest parts of your stack. They let you view your application from the customer’s point of view by tracking customer satisfaction, most popular web requests, and SQL query performances. APMs run all the time so developers know exactly when performance issues arise.
Cons: APMs are usually priced per server. However, some APMs are more affordable than others.
Real user monitoring (RUM) relies heavily on services that constantly measure the application in the background. This is done by a small JavaScript in a webpage that will collect some data as the user browses the web application. One of the main uses of RUM is to record which pages are being viewed by the users and how long they stay on each one. This kind of data is useful to decide where to put ads or where to put information for maximum viewability. The data gathered from RUM can also be used to improve the user experience of a website or application.
For those who are new to RUM, one basic example and is considered very famous is the Google Analytics. Over the course of time, there has been a silent battle between monitoring of real users vs. synthetic transactions. Customers often ask whether which approach should be used over the other. The truth is both approaches are relevant and they complement each other. Here is an article that tackles an in-depth comparison of RUM versus synthetic monitoring.
Pros: The advantages of RUM mainly focused on its ability to measure the experience of actual end users. Aside from users’ experiences, the user location, browser, ISP, device and all application infrastructure components are also measured. With RUM, you can quantify PHP performance problems by business impact for rapid isolation and resolution. It allows you to see and understand the intricacies of who is using your web application. It provides an overview of how to know your key users and customers. It offers a segment for refined analysis, and identify the ways you can improve their experience. Most of all, it establishes baselines for performance such as improving conversions by decreasing errors and page load time.
Cons: For all the benefits of RUM, still it has some disadvantages. RUM’s ability to measure the experience and its attention to detail can generate N number of users multiplied N times the data. This level of precision naturally results in a more accurate diagnosis of end-user experience, both individually and in collective segmentations, but responding to specific issues can prove unwieldy if your tools lack the capacity to conduct root-cause analysis and to generate intelligent, prioritized decision analytics — leaving the bulk of data analysis and next steps up to a likely overwhelmed and under-resourced DevOps crew.
Still, no matter how basic or sophisticated your RUM solution is, it’s generally hard to complain about having too much accurate information. A more serious limitation of RUM is this: Even when you’re continuously monitoring 100% of your real users, how can you monitor the performance of a new app function or site feature ahead of time, before re-deployment? And what about real-time monitoring during periods of low engagement, such as late at night, when there are far fewer people using your application? Is RUM the best way to check performance then?
For Retrace to be able to monitor a web application, the time, request path, status, and log event date must be present in the web server’s access logs. These parameters, if not present in the logs, can be enabled in the configuration of the web server. Using the data collected from the access logs, Retrace is able to formulate the requests per minute, average load time, and HTTP error request data of the web application.
PHP, like other programming languages, handles exceptions pretty well. Exceptions are very important to track because they usually stop the execution of a system. But if the system is throwing exceptions in the back-end, e.g. web services, then it’s hard to keep track of these exceptions.
$file = "file-not-exists.php";
if (!file_exists("../app/models/".$file)) {
    throw new Exception("{$file} was not found");
}
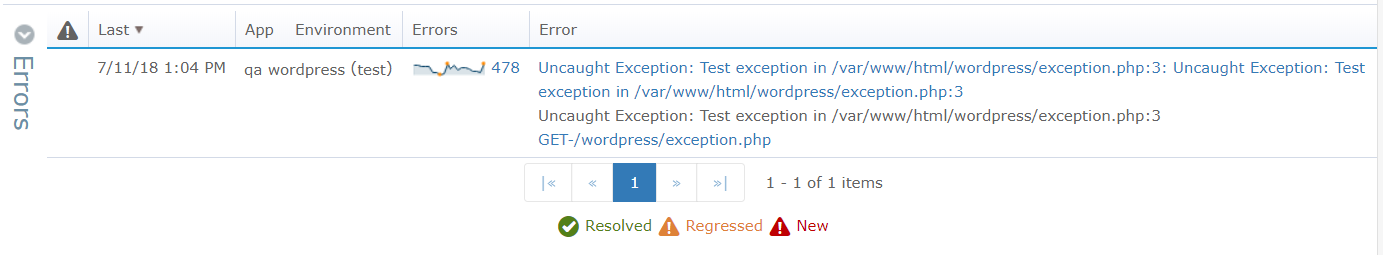
Most of the time, these errors are logged in the web server’s log. Developers might not have access to these logs so that’s why it’s crucial that such exception tracking is readily available to developers using an error tracking tool.
These articles provide additional information about APM tools that might be useful for your PHP applications.
Stackify's APM tools are used by thousands of .NET, Java, PHP, Node.js, Python, & Ruby developers all over the world.
Explore Retrace's product features to learn more.


