
I use performance monitoring tools primarily to find slow and buggy code. At the start of development, I typically use the tools more for finding software bugs. Once the codebase is at a relatively stable phase, then I shift my focus toward finding less performant code. Which is why I turn to tools like Retrace to help with profiling for better performance. In this article, I’ll focus more on the performance monitoring usage of PHP profilers, especially in terms of code-level performance. I’ll use Retrace to show how you can profile your PHP codebase and trace through your code transactions. Then I’ll dive a little deeper into the use of traces as a means to surface your slowest functions and queries. In fact, I’ll use an actual codebase for a client project to show you the basic steps of profiling.
Here’s a look at the topics I’ll cover:
Did that whet your appetite? Let’s dive in!
These days, code is becoming increasingly complicated. The term “full stack” started getting popular in 2014 precisely because, by default, nobody can know the full stack any more. There’s just a huge explosion of new technologies, layers, and devices out there in general. And it’s not just your own stack. There are microservices, API calls, and serverless functions from other platforms.
But with profiling, developers can get a better understanding of how their web applications are performing. And they can do this function by function, query by query. In a nutshell, profiling gives you visibility over your web application’s performance.
With that in mind, I deliberately chose a real-life client PHP project to run profiling on. Because nothing beats an actual project to show you, in the greatest clarity, how profiling really works.
For profilers, there are three types:
Let me cover these briefly.
Standard profilers tend to look at method or line-level profiling. Profiling at the method or line level can be really slow. Although this means you get a highly granular picture, you wouldn’t want to do that often—maybe at most two or three times a year. In most cases, you’d turn this on for your local environment when you need to look for a weird CPU performance issue. But note that if you do turn this on, the profiling can slow down your application.
Another type of profiling, transaction tracing, is lightweight enough to be the kind you can use in day-to-day development. It doesn’t slow you down unnecessarily, and it surfaces any performance issues almost as quickly as you can write code.
Finally, APM is for you to install on your development, staging, and even production servers. You can run these tools all the time. Therefore, it’s crucial the overhead on the servers is low even when you turn on the APM tool you installed. For a more detailed breakdown of how these three types of profilers differ, check out the article here.
Of the three types of profilers, I’m going to focus on the APM tools. This area can be further subdivided into three types. This Stackify analysis of APM tools breaks them down:
I’m going to focus on code-level performance for my PHP web application.
Now that you know the various types of profiling, how do they differ from tracing? Tracing is probably a more tactical-level activity, while profiling is more encompassing. Also as a developer, you’re likely more motivated to employ tracing for finding bugs. If that’s the case, you may want to read this more detailed write-up of how tracing helps with bug-finding.
In contrast, profiling is about building an inventory of performance events and timings for the execution throughout your web application usage cycles. If you run profiling on the production environment, you can even build a detailed picture of how performance is affecting your users in real life.
And now finally, it’s time for the main event! In the next five sections, I’ll use a real PHP code project to show you how I use Stackify’s Retrace tool to do a simple profiling to find slow-performing queries and functions. For confidentiality reasons, I can’t show you the actual code. However, by trying out Retrace properly with a real PHP codebase, you can get a good sense of how useful profiling can be. So let’s get started!
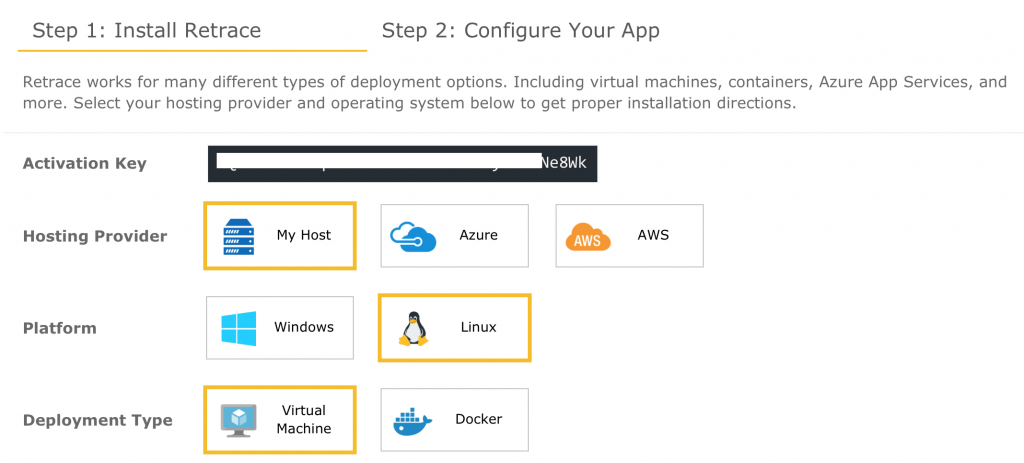
Begin with signup and installation. I recommend starting with the local development environment so you can start dipping your toes into PHP profiling. This way, you’ll get the best of both worlds: minimizing the risk to the production environment, while running as close to actual code profiling as possible.
After you select the configuration based on your environment, you can copy and paste the installation command. The installation command is also provided to you right in the same page. Note: Make sure to change the last argument to “QA”.
Here’s your installation command:
wget https://s1.stackify.com/Account/AgentDownload/Linux --output-document=stackify.tar.gz
&& tar -zxvf stackify.tar.gz stackify-agent-install-32bit && cd stackify-agent-install-32bit
&& sudo ./agent-install.sh --key <your-activation-key> --environment QA
Your follow-up step would be to update the php.ini to include the Stackify extension. In my case, I have a legacy PHP 5.6 web application running php5.6-fpm on nginx. So I went to /etc/php/5.6/fpm/php.ini to append the following code:
[stackify]
extension=stackify.so
stackify.application_name=Test Application
stackify.environment_name=QA
Notice that the environment_name matches the last argument of our installation command.
Restart all your services. In my case, that will be the following:
sudo service php5.6-fpm restart
sudo service nginx restart
Your commands may differ depending on your Linux operating system version and the services you use.
Run the phpinfo web page, and you should see a Stackify extension being turned on:
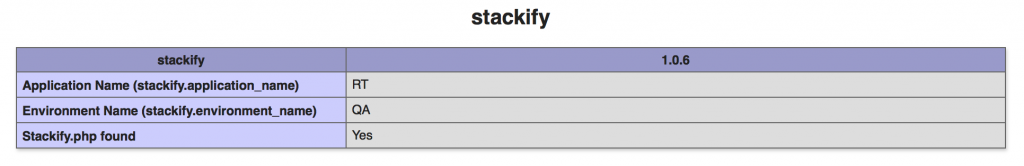
Ta-da! You had a successful installation of Stackify.
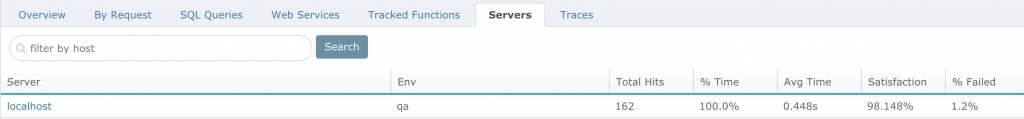
Now, go back to your Stackify dashboard and check under Monitoring > Servers. If you see what’s represented in Figure 3, great news! Your server was detected on the Stackify dashboard.

More importantly, your server is rated as Available and Online.
Now that I’m done with installing and setting up, I’m ready to go ahead with profiling. These are the next steps:
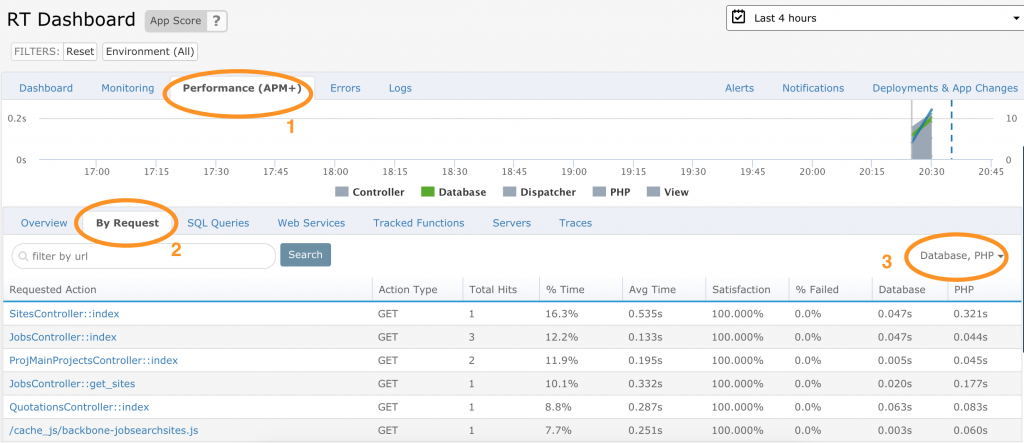
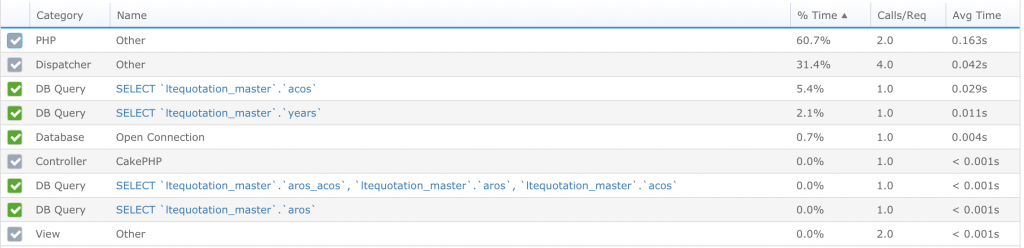
Now, let’s consider if we want to look at the requested action with the biggest time spent in the PHP section. In this case, that will be SitesController::index. When I click on it, I get this breakdown:
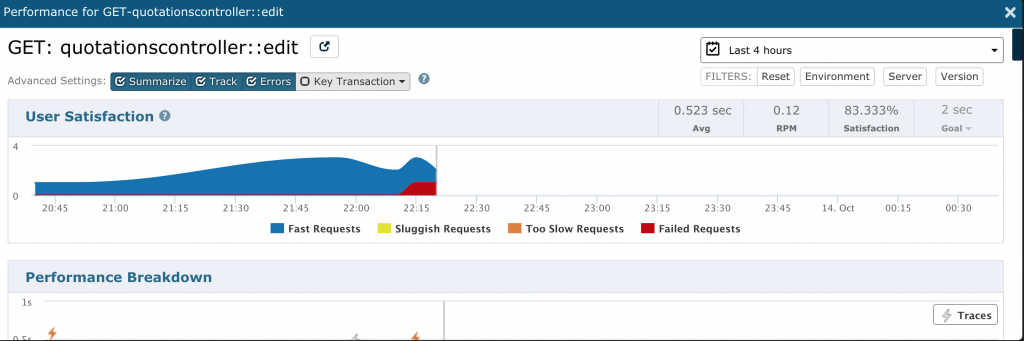
Another great way to drill in is to click on “Traces.” For example, I want to improve this particular requested action: GET-quotationscontroller::edit.
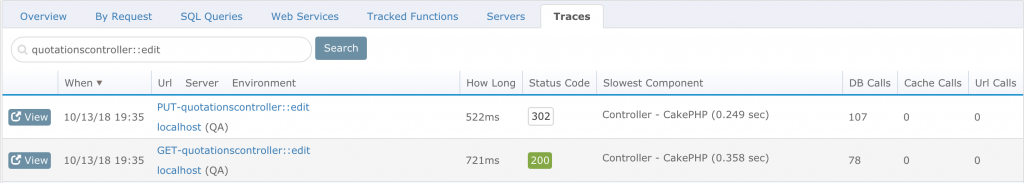
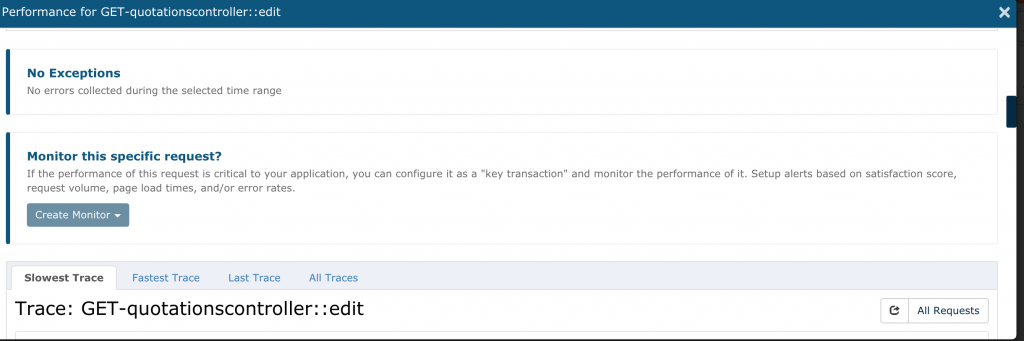
Before optimization, my GET-quotationscontroller::edittook around 721ms. When I click on “View” to drill down further, I see the exact time spent per query and PHP function:
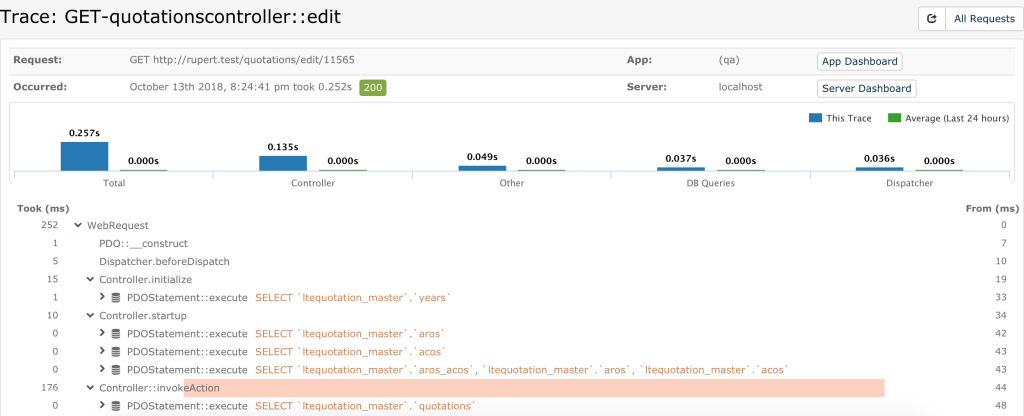
On the left-hand side of the Figure 8 image, you can see how much time each function or query takes in milliseconds (ms). Furthermore, those that take too long based on the profiler are highlighted. In my case, as you can see in this screenshot, Controller::invokeAction is highlighted for taking too long.
To address this, I decide to focus on those queries that take the most time. As a developer, this is like playing a game. I start by targeting the most inefficient queries. After I select one, I get into a tight change-check-change loop until I get the results I need.
Another great way to optimize is to look through all those slow queries and single out the ones that are no longer necessary. The best code is no code.
After I remove or optimize the performance of the highlighted item(s), I refresh the Traces tab and get this:
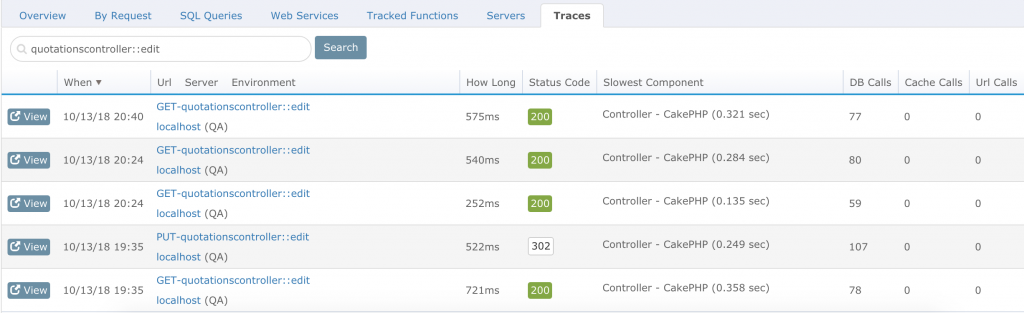
Now, my time taken for GET-quotationscontroller::edit has gone down from 721 ms to about 575 ms. Which is pretty amazing, given that I wasn’t even aware there was inefficiency there in the first place!
After seeing this demonstration of an actual PHP codebase being put through its paces by Retrace, you may be wondering, “What stack are you using? Does this apply to my PHP stack?”
My client profiling project uses CakePHP 2.x, PHP 5.6, and MySQL. You can use other popular technologies and frameworks as well, such as the following:
You can view a complete list of supported frameworks in Stackify’s documentation. As long as you’re running popular PHP frameworks and CMS systems, there should be no issue with using Retrace to produce the same results I did.
So now that we’ve looked extensively at how to optimize a requested action in a PHP codebase, you may be wondering what else we can do.
You’ll recall I mentioned earlier that a profile builds an inventory of performance events. In addition to tracing all the performance of the queries and functions involved in your application’s calls, Retrace also lets you add log management.
Logs can easily be sent via a simple configuration change to popular logging frameworks like log4net, NLog, Serilog, Log4j, logback, and more. This means logs such as the following can contribute to building a complete picture of the performance health of your PHP application:
This is how logs are shown in Retrace:
I mentioned how complexity is increasing with microservices and platforms providing API calls. This means monitoring your application performance becomes more crucial if your application relies heavily on external services. In-depth tracing, even to the point of external calls, therefore becomes more crucial as well.
While my PHP project doesn’t directly call any external API calls (at least not yet!), I can show you how tracking external API calls should look in Retrace:
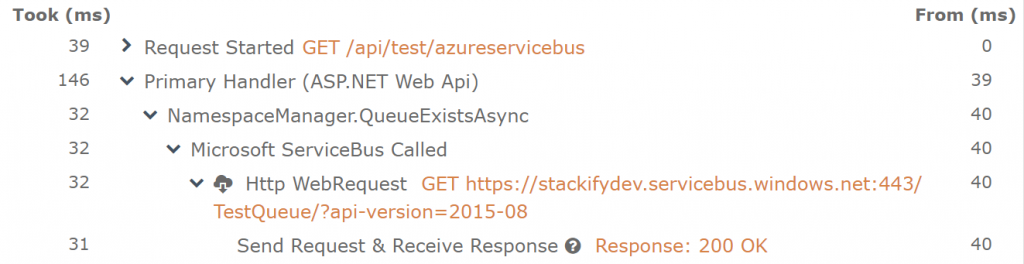
In this .NET example (Figure 11), notice how tracking external API calls becomes part of the “Traces” view as well. If your PHP code calls external APIs, you can expect the same kind of tracking as well.
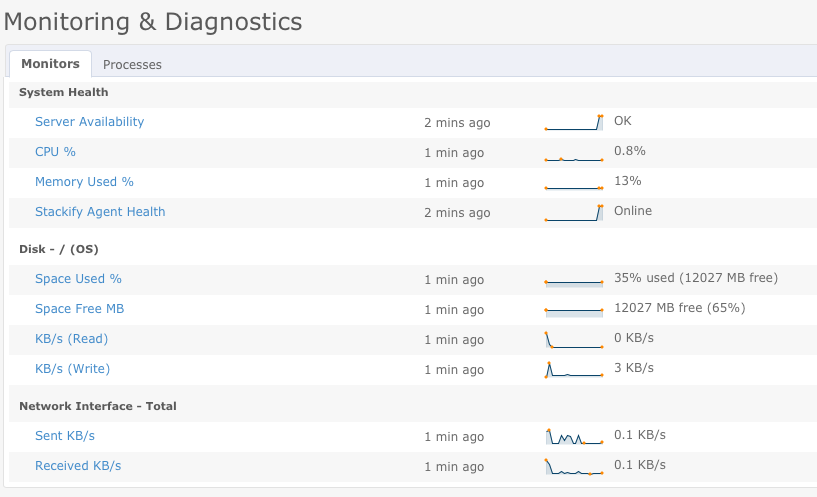
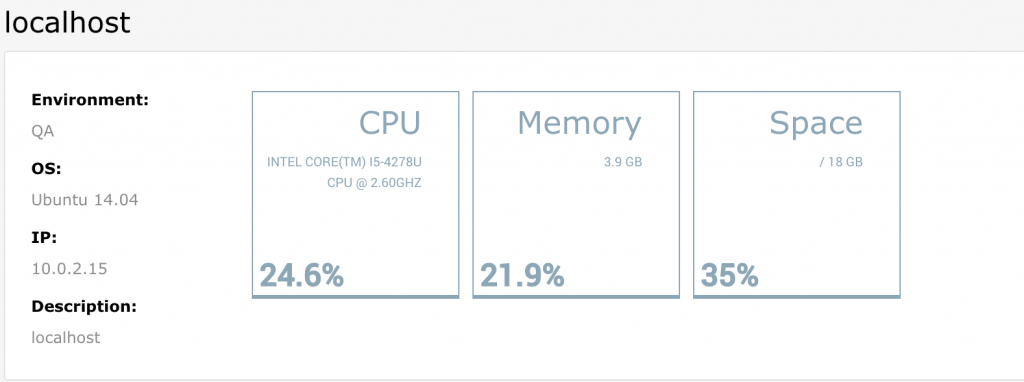
On top of tracking performance at your application layer, Retrace also monitors server performance. The screenshot in Figure 12 displays the performance stats of my local development environment, which is essentially a VirtualBox instance:
By drilling into the specific server instance, I can even get an idea about the network, storage, and other relevant server stats:
Every once in a while, you may face an issue where you have a few tricky requests or transactions that you can’t immediately optimize. You need to monitor the situation more closely over a substantial period of time in a production environment. This is where the option to select key transactions can really shine.
Remember the example of optimizing the GET-quotationscontroller::edit request? What if I wanted to specifically target it for an extended period of monitoring? I can do that by directly clicking on it and adding it as my specific monitoring.
That brings up a modal window like this:
Scrolling down, there’s an option for creating a monitor:
This lets you specify which environment (assuming you install your monitoring on multiple environments for your application) you want to set this specific monitor to.
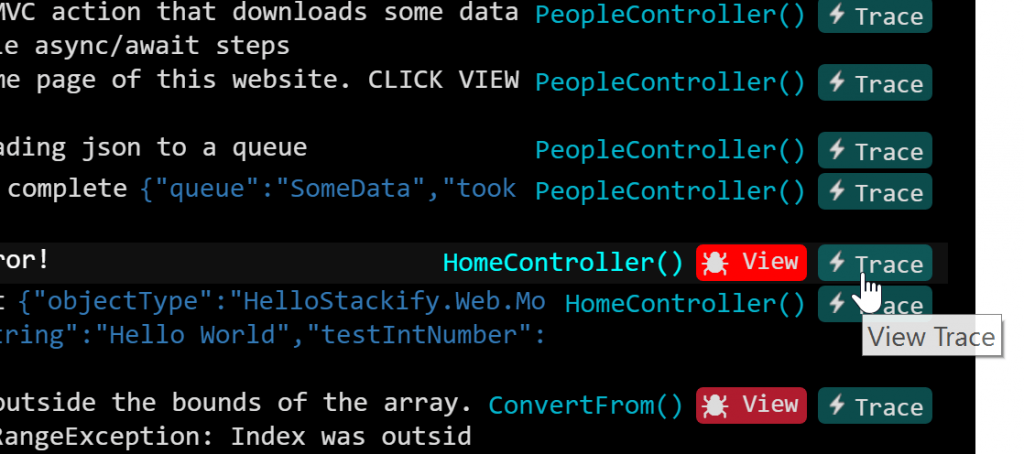
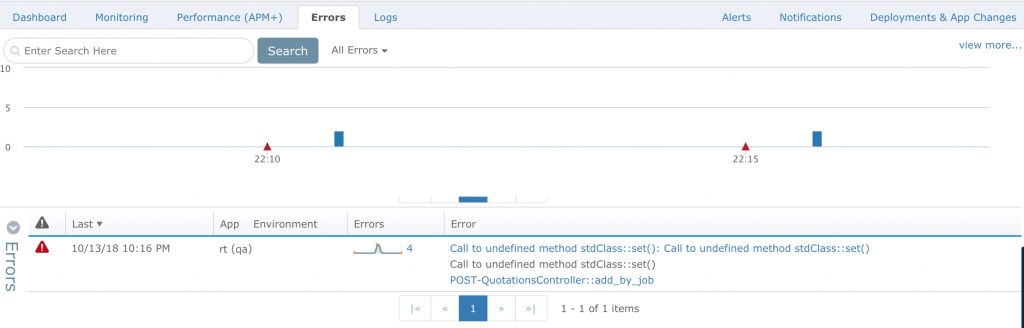
I run into this all the time as a developer: No matter how extensively I tested my application using both automated and manual testing, my real-life users still manage to find errors. But when I ask them how they produced the errors or bugs, they have a hard time explaining it.
With error tracking, you can get an exact picture of how errors occur and what they really are without relying on your non-tech-savvy users. In this “Errors View” window, I can see the errors I generate in my PHP codebase while optimizing:
This article covered the theoretical areas of a profiling tool and the strong reasons why you need to make profiling part of your developer toolbox, given the increasing complexity of technology. From there, I took a deep dive into how I used PHP profiling to make visible and optimize a real-life PHP codebase. I also looked at the effects of profiling on code-level performance.
Next, you saw the five steps from installation to optimization I used for an actual requested action. With the “Traces” view in the APM, specific paths within an application became visible in great detail. (You can read this article to learn even more uses of the “Traces” view for profiling.) This article also covered the other information you need to build a more complete profile of your PHP application.
Before I end, here’s a gentle reminder: Once your profiling surfaces the inefficient part of your code, attack the low-hanging fruit. Target the slowest paths and delete those that are no longer needed. And trust me, all codebases will definitely have some unnecessary fat. Run a profile to find them and trim them. You’ll be glad you did.
Stackify's APM tools are used by thousands of .NET, Java, PHP, Node.js, Python, & Ruby developers all over the world.
Explore Retrace's product features to learn more.


