
Stackify’s APM+ product, Retrace, helps provide important insights into your code, and one of the important pieces to understand is the Traces view. The ‘traces’ can be found in the ‘Performance (APM+)’ tab when viewing a specific application.
’ tab when viewing a specific application.")
Traces allow you to view specific paths within an application with great detail. These can be extremely helpful in determining where problems are happening and how to fix them.
Stackify instruments every request to build the statistics that you see on load time, requests per minute, user satisfaction, etc., but we do not store every single trace. We have an algorithm that will look for “interesting” traces – this could include traces that contain an error, are outside of normal user satisfaction acceptability, etc. As long as the application is getting steady traffic, Retrace should be saving a trace at least once every 5-10 minutes. This ‘smart sampling’ is based on how well the requests are performing. Underperforming requests get profiled more often than well-performing requests. The goal is to show you the possible problem areas for you to find and improve.
Let’s look at an example from our HelloStackify.Web application from our sandbox.
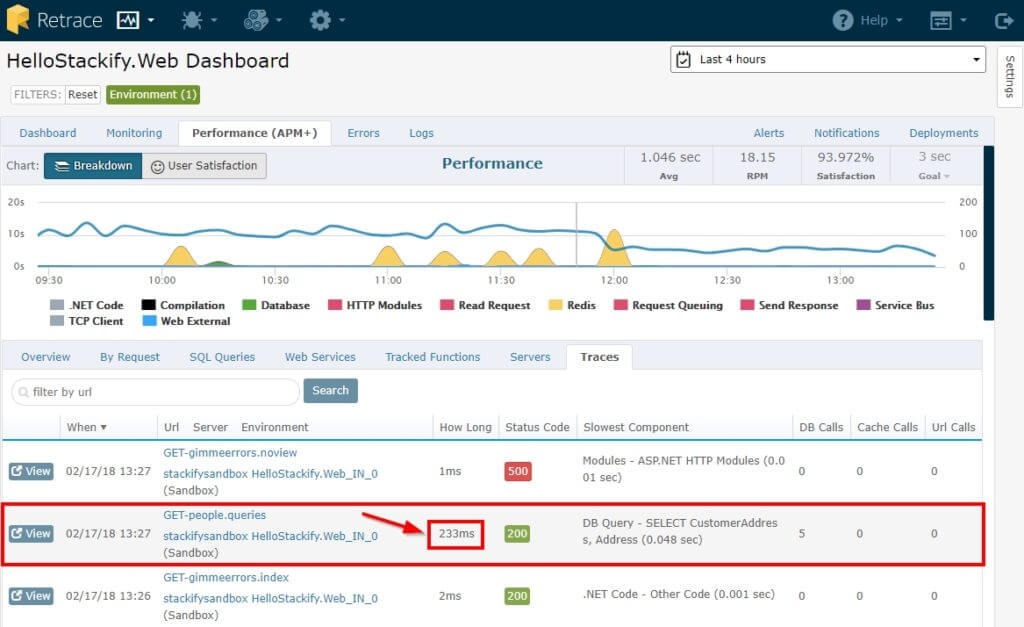
If you take a quick look in the traces tab and notice that the ‘GET-people.queries’ action had a loading time of 233ms, then you’ll want to explore what is taking so long with that specific trace. Instantly, Retrace shows the ‘Slowest Component’ and you know it is something in the SELECT statement from a DB Query.
You still want to know more, so click the blue ‘View’ button to load the specific trace view and the following Trace View is displayed:
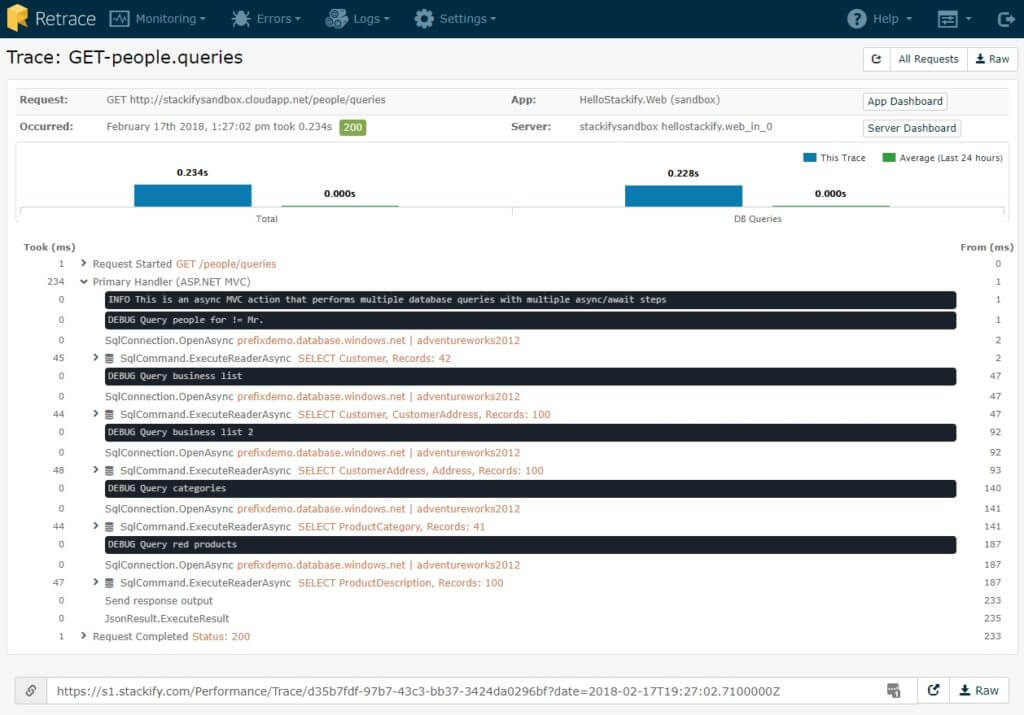
This view provides ample information around this specific trace that is extremely beneficial. You are able to view the Request, specific time it occurred, app name, and server. The graph shows you specifically two items:
Retrace also provides a direct view into the entire lifecycle of that request. In the view above, we can see the timing on each specific step, the ‘INFO’ and ‘DEBUG’ log messages, and very specific information about the database queries.
It also provides the ability to dive into the exact SqlCommands and see the exact query.
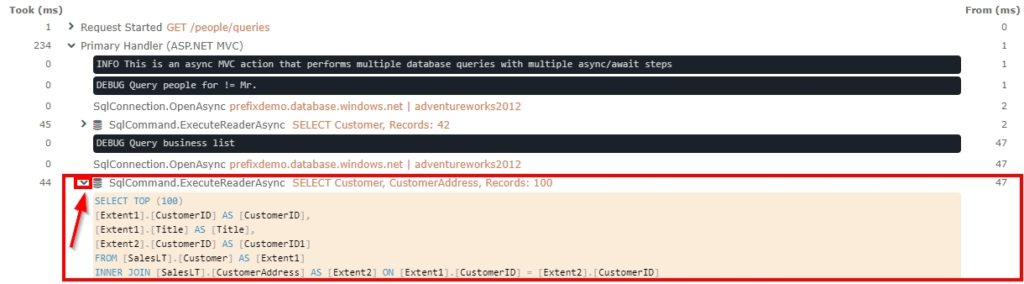
If you click the caret next to the SqlCommand, you will be able to get insights into the exact query. Here we can see the entire SELECT statement that was called, how long it took, and the parameters within the statement. The number of records extracted will also be available. Stackify takes our client security measures seriously, so we do not provide insight into the exact information or records that were returned.
The example in this trace shows multiple database queries being performed and if it was notoriously slow, a Retrace user would know exactly where to start optimizing this action to improve performance.
Traces include all types of information, so let’s look at another example that includes an error:
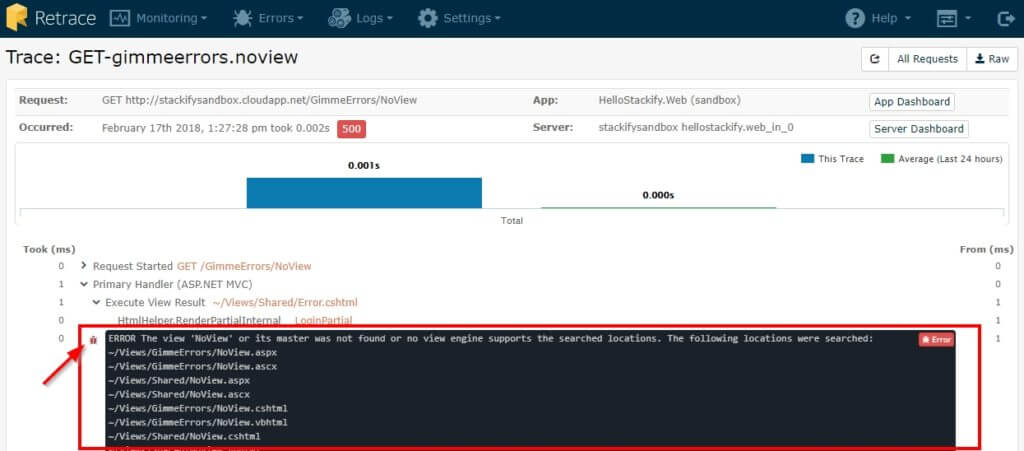
This time, we are viewing a trace for ‘GET-gimmeerrors.noview’. All the same information from the first example is still prevalent (request, time, app, and server), but now we are able to see an error is present in this trace. This is extremely powerful because the user is able to get a full picture of where in the action the error occurred, what is going on, and how the remaining parts of the action were affected.
Retrace also provides a great sharing feature within our trace views.
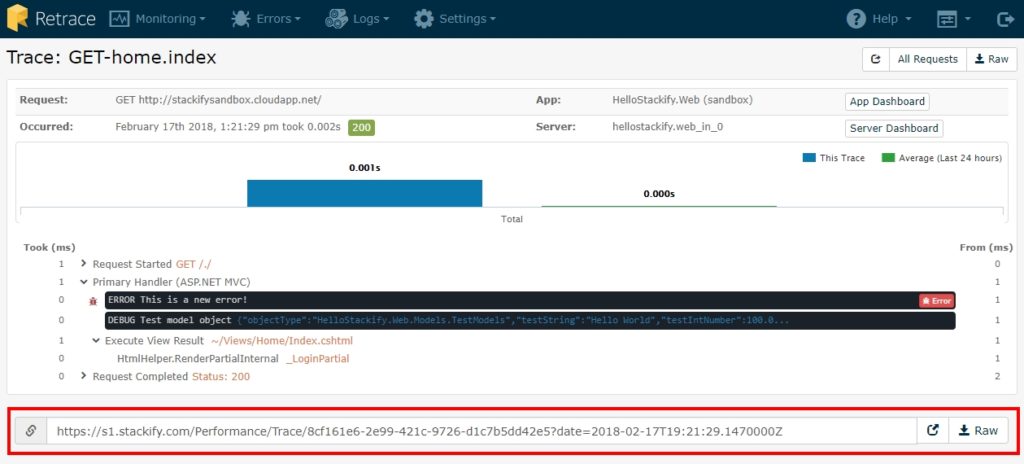
This allows you to share an exact trace with a team member, client, or any other person who would find value in seeing it. You can copy the exact URL into an email, post it in a Slack channel, or export the Raw Document. This can be extremely beneficial for team work and maximizing exposure with certain important issues. Internally at Stackify, we share these to help make sure everyone can have visibility into specific issues that we are trying to fix and prevent again in the future.
Traces are a great way to get a granular view into exactly what is happening within an application. Retrace is proud to offer such great insights for our customers. If you have a follow-up question, or would like a specific walkthrough within your account, do not hesitate to reach out to Team Heisenbug at [email protected] for more help!
Stackify's APM tools are used by thousands of .NET, Java, PHP, Node.js, Python, & Ruby developers all over the world.
Explore Retrace's product features to learn more.


