Retrace combines several tools that developers need for application monitoring in one easy to use tool. Retrace has some really amazing log management and error tracking features because of the tight integration between our APM, errors, and logging tools.
In this article, we are going to highlight some of the top features that you should be using with Retrace!
Retrace gives developers the ability to see all of their application errors and logs in one place. This makes it easy to search and filter your logs when debugging problems with your applications. The problem is that you still have a ton of log files to sift through. These two features can help you organize that massive mountain of logging that your code produces!
If you haven’t heard of structured logging, you are missing out! The goal is to log “properties” or “objects” so that you can later search for those fields, or do more advanced analytics on them.
For example, at Stackify we use this to always log your clientid along with our logging messages.
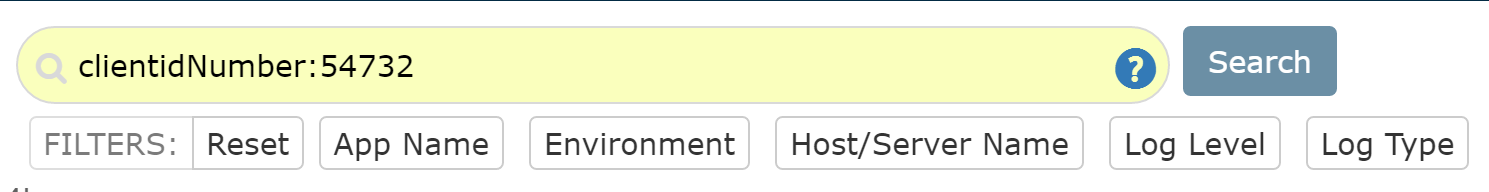
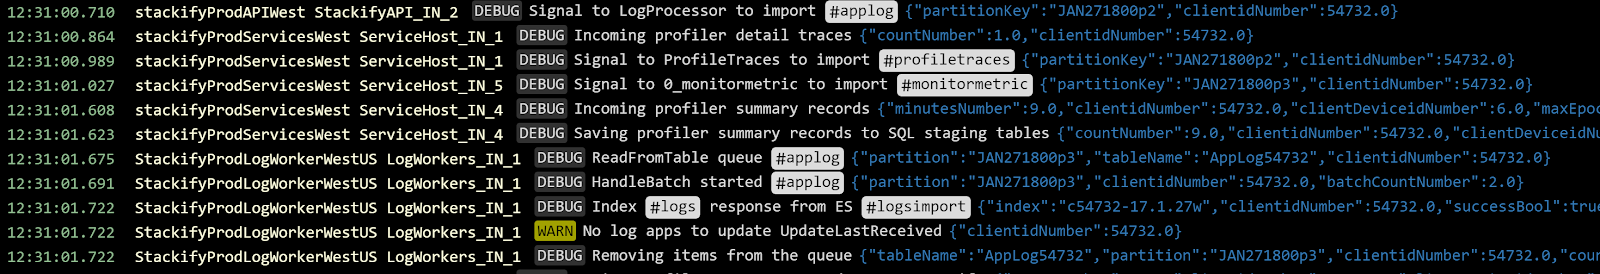
log.debug(“Incoming metrics data”, new {clientid=54732});
This enables us to search our logs like shown below to only see log messages that are filtered down by that clientid. This makes it a lot easier to troubleshoot issues specific to a certain client.
Note: Retrace supports structured logging for most common logging frameworks.
If you have ever used hashtags on Twitter or Instagram, you know how powerful it can be to search by tags. They make it easy to search for a specific topic, category, or subject.
Retrace makes it easy to use hashtags in your application logs. All you need to do is add a # to your log message and Retrace will automatically recognize it.
// Adding tags is as easy as adding a #

 log.debug("Write to #queue complete");
The log viewer will then automatically highlight your tags in your log text. You can also quickly search by the tags by searching “tag:queue” (based on this example).
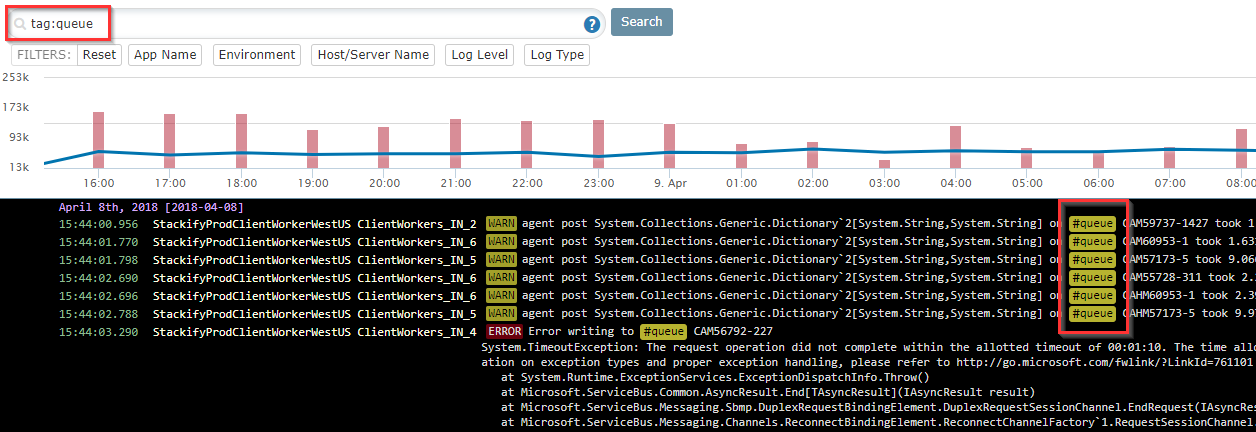
Tags make it easy to quickly search by a specific function, or part of your application. It is also really powerful to use with Retrace’s log monitoring. You can setup a search for a specific tag and have it alert you if it is found. This is great for monitoring for really weird issues that you only identify in your logs.
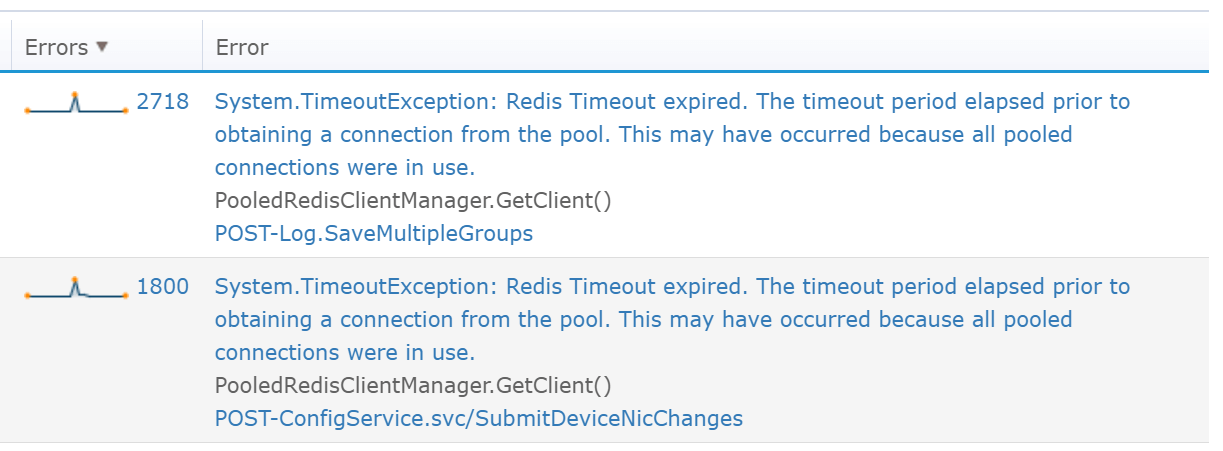
The exceptions being thrown in your code are often your first line of defense when it comes to identifying application problems. Retrace can help you find all the exceptions being thrown in your code. You can use this to identify issues that are impacting your customers or causing weird behavior in your code.
Retrace can track exceptions in 3 different ways:
Retrace’s automatic unhandled exception tracking works well for web applications. It will automatically catch any exceptions that would have resulted in a 500 internal server error response.
If you want to do some serious exception hunting, you can modify your “Environment” settings in Retrace to enable collecting all first-chance exceptions (.NET only). This will collect every single exception being thrown in your code.
Go to Settings> Environments> Select an environment
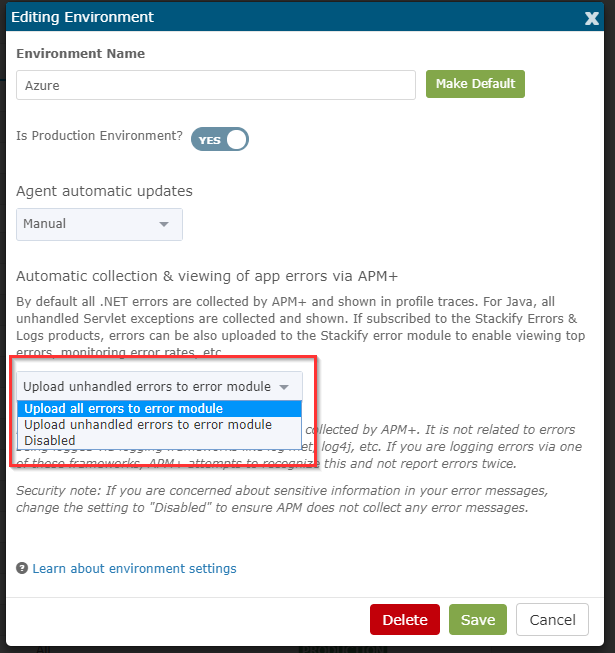
Note: Collecting all first-chance exceptions in .NET can collect a lot of “noise” errors. We suggest doing this in non-production environments to test first.
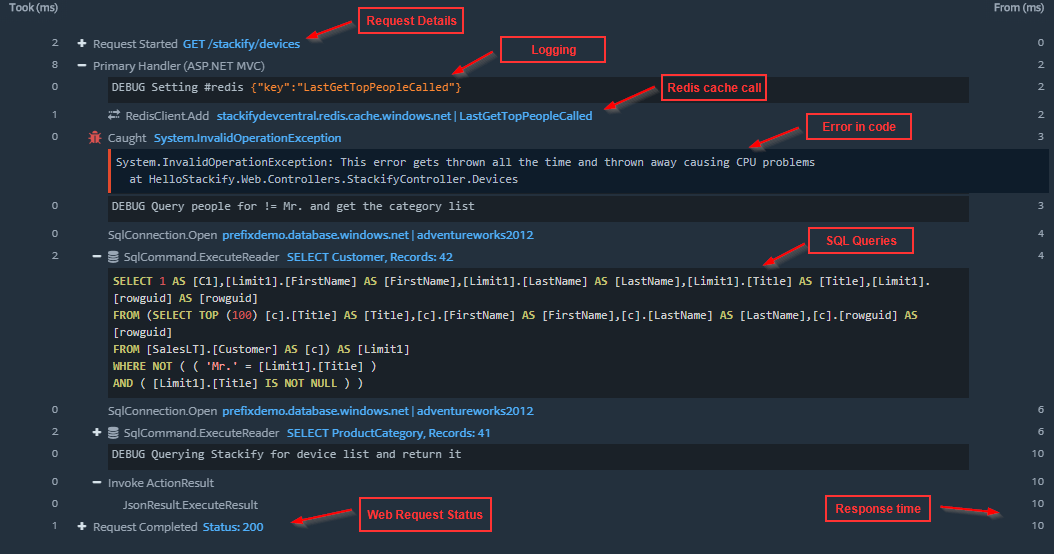
At the heart of Retrace is a powerful code profiler. It tracks specific methods in your .NET and Java applications to help understand the performance and behavior of your code. Retrace provides some of the most detailed code profiling traces of any APM solution you can find.
Retrace’s code profiler tracks things like SQL queries, HTTP web service calls, and the usage of DOZENS of common application dependencies and frameworks. Things like Redis, Elasticsearch, MongoDB, and many others.
One of the most powerful features though is the combination of your logging with the code profiling that we do. Your logs can provide a great deal of context to what happened within a web request or transaction.
You can use Retrace’s powerful code profiling feature for free on your workstation with our free tool, Prefix (on Windows only). Use it to help debug and optimize your code while you are writing it!
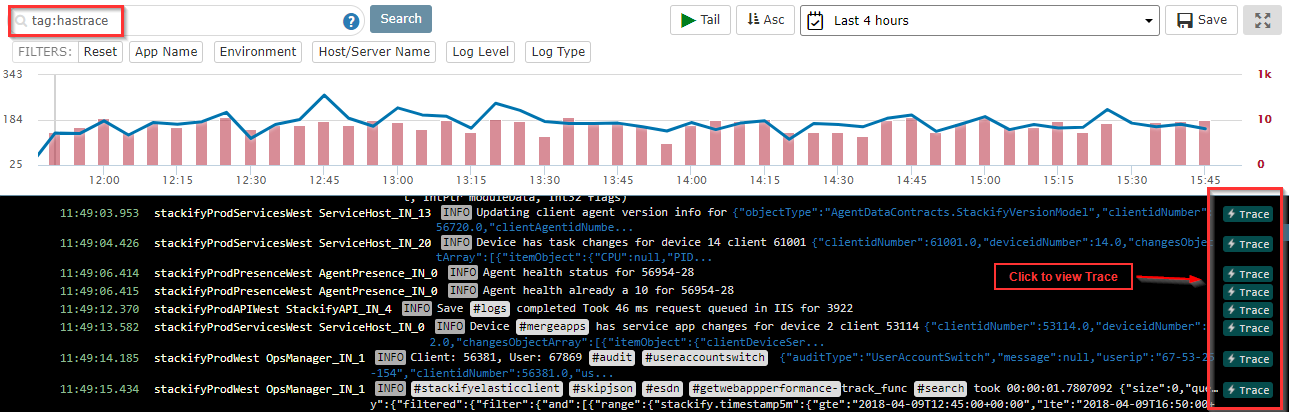
Did you know that you can also jump from a log statement to view the full trace that it was part of? #mindblown
When searching for logs, just look for the “Trace” button on the right hand side. You can filter down to these if you like by searching for “tag:hastrace”. By the way, we don’t collect traces for every single transaction, so they won’t appear for all of them.
Deployments are stressful. We all want them to go perfectly, but we also know that odds are we will break something in the process. The good news is Retrace can help you find exceptions and performance problems before, during, and after a deployment.
Retrace supports deployment tracking via several common deployment tools like Team City, Octopus Deploy, Jenkins, Bamboo, and many others.
You can use this to track when a deployment is done and look for new exceptions that happen just after a deployment.
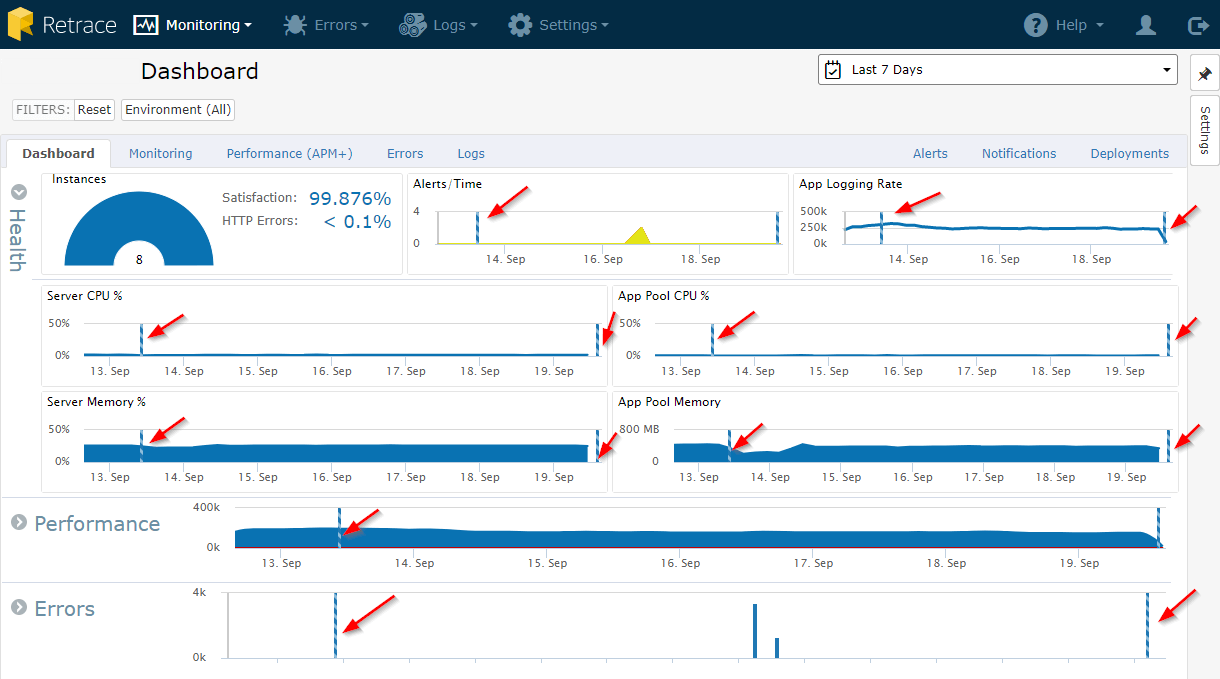
Retrace includes several powerful monitoring capabilities that you should be aware of. Retrace can monitor how many errors are occurring with your application, and even notify you about new errors.
Error rate monitors are created automatically for every application. You can view them within the application dashboard for any of your applications. You can also view them across all of your applications by going to Monitoring> Error Rates.
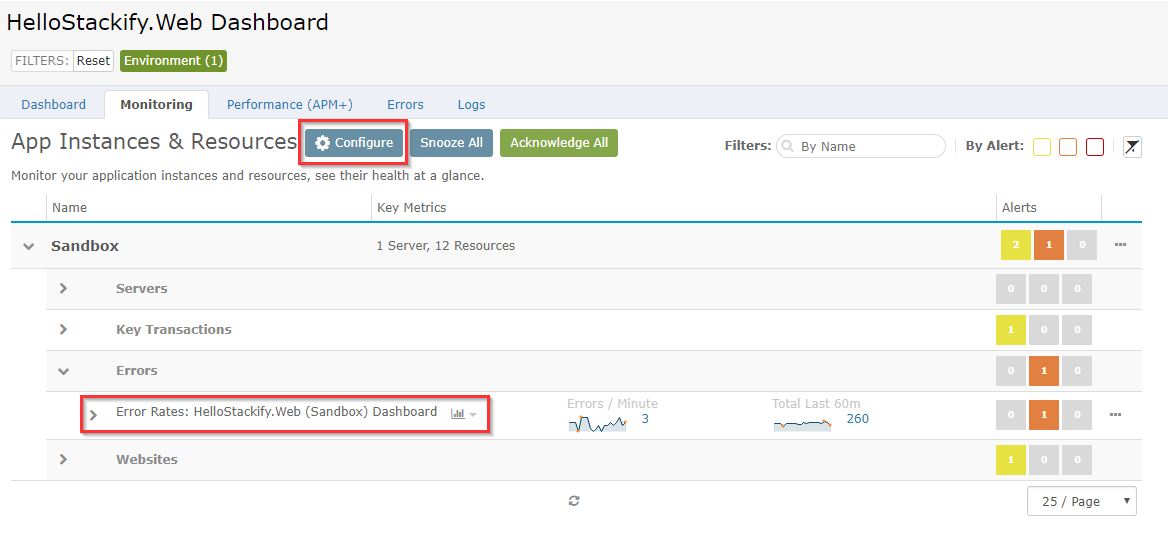
We suggest always configuring a monitoring alert to catch sudden big spikes in errors that you would otherwise not know about. A simple monitor of 500 errors in the last 60 minutes is a good best practice.
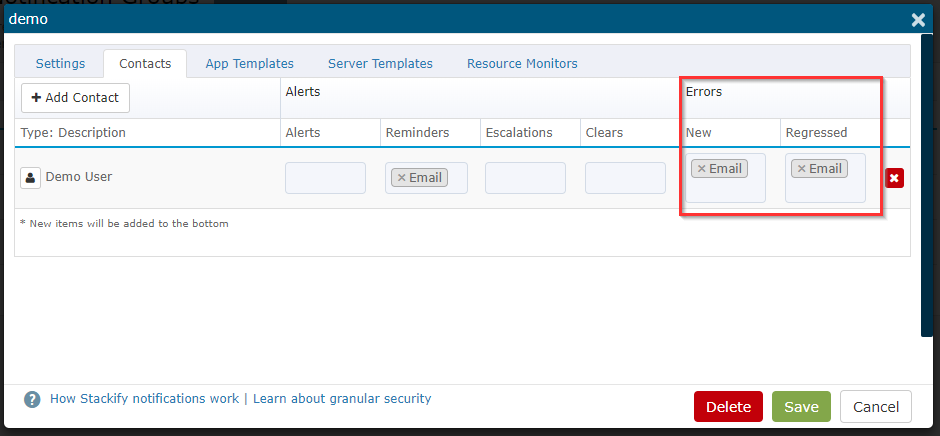
Retrace can email you anytime a new exception is found. One of the advantages to Retrace is its ability to identify unique errors and know which ones are new. Instead of spamming you everytime there is an error, it can only alert you about new ones.
Go to Errors> Notification Groups to configure your notification groups and who should receive email or SMS notifications. You will also want to go to the “App Templates” tab, and select which apps you want to configure alerts for.
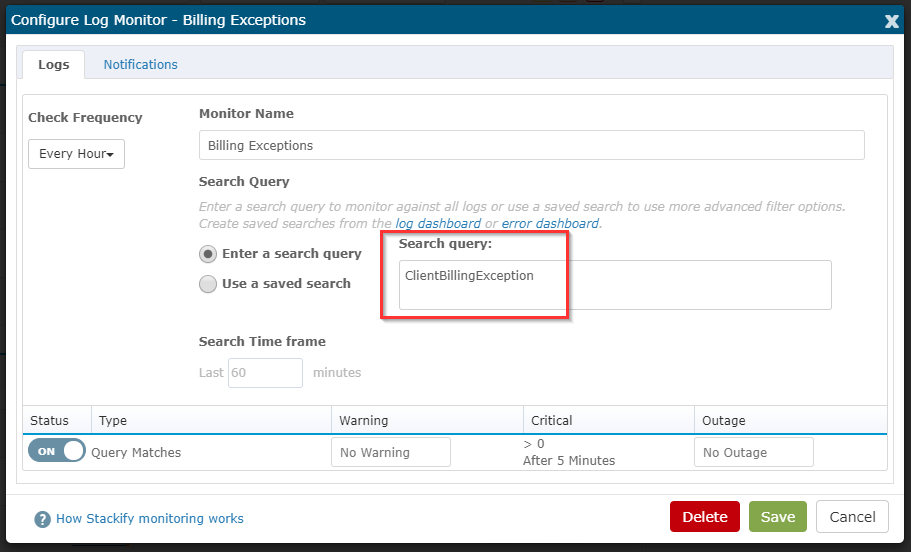
Sometimes the only way to monitor your application is to look for specific log messages. Retrace can help you do just that!
For example, we have some background jobs that run daily to do billing. If there is any type of error or problem with our billing, it would be a really big deal. Monitoring this type of background process is tricky. We monitor it by using a specific exception type called ClientBillingException. We then configure Retrace to alert us if that is ever found in any of our logs!
Retrace includes a lot of powerful error tracking and log management features designed for developers. It was really hard to pick my top 5, but I think these are some of key features that every development team can get a lot of benefit from. I especially love being able to see log messages within the profile traces. Don’t forget that you can get that same functionality on your workstation while you are writing or testing your code with Prefix on Windows for free!
Stackify's APM tools are used by thousands of .NET, Java, PHP, Node.js, Python, & Ruby developers all over the world.
Explore Retrace's product features to learn more.


