
No matter how carefully coded, reviewed, and tested your Ruby code is, odds are good that at some point you’ll cause a catastrophic failure to at least one system you’re responsible for. How do you prepare yourself? You need a Ruby debugger.
In this post, I’ll cover the whole Ruby debugger process—from finding the issue to determining the root cause. Use these instructions for debugging a single Ruby file, a Rails app, or a gem. I’ll also include a detailed explanation of how to set up your development environment and how to use the ruby-debug-ide gem and Visual Studio Code to investigate the state of your system to find the root cause of an error.
An example of a high-performance team that often needs to find the root cause of a serious issue under pressure is the mission control team at NASA.
Gene Kranz, director of the mission control team that saved Apollo 13, sums up their approach to problem-solving when he said, “Let’s work the problem, people. Let’s not make things worse by guessing.”
We can use Kranz’s simple, yet important, strategy when we approach debugging a Ruby application.

Source: Wikimedia Commons. Gene Kranz at his console on May 30, 1965, in the Mission Operations Control Room, Mission Control Center, Houston.
Finding production errors before your users report them gives you some time to think calmly about the solution. When you find errors early, your users may not notice that the error occurred, which gives you more time to determine the root cause and fix the issue. Under pressure, you may be tempted to provide a quick fix for the effect rather than the cause, without understanding the purpose of the code. I’ve made this mistake many times, so I can tell you from experience not to do this. It often causes a different issue or accelerated software rot.
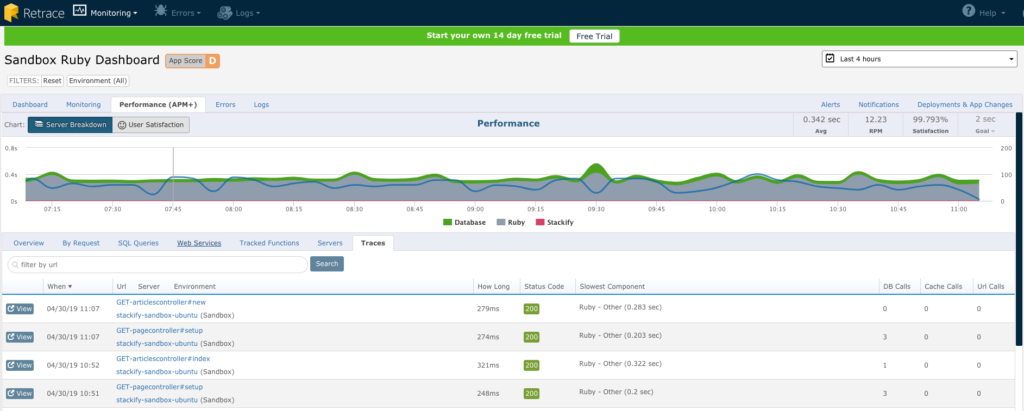
A good way to find errors fast is to use an application performance management tool (APM). One such APM, Retrace, reports all errors as they occur, along with a stack trace and any related logging.
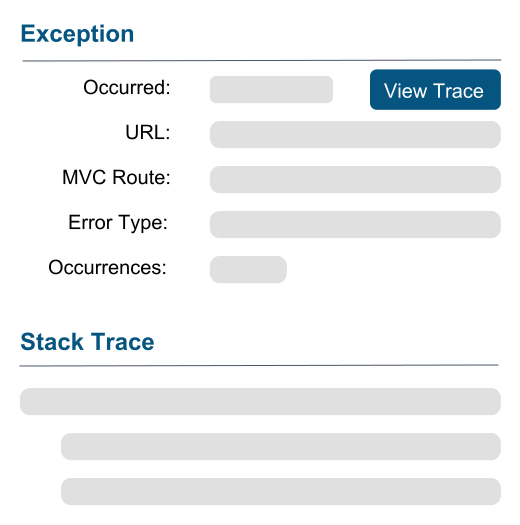
The best place to start your investigation is at the point the error was first discovered. If you have an APM like Retrace configured, then all errors would be searchable along with the related stack trace. The stack trace could be sent as a screenshot from a user, or could happen during your own testing.
A stack trace is an output generated from an application when executed, showing the line of code that caused an issue and the execution path through the system that led to that point. The following is an example stack trace from a simple program that shows a common Ruby error: undefined method.
undefined method `id=' for #<User:0x00007f908847b1c8 @name="bob">
app.rb:5:in `<top (required)>'
gems/ruby-2.3.7/gems/ruby-debug-ide-0.6.1/lib/ruby-debug-ide.rb:92:in `debug_load'
gems/ruby-2.3.7/gems/ruby-debug-ide-0.6.1/lib/ruby-debug-ide.rb:92:in `debug_program'
gems/ruby-2.3.7/gems/ruby-debug-ide-0.6.1/bin/rdebug-ide:182:in `<top (required)>'
gems/ruby-2.3.7/bin/rdebug-ide:23:in `load'
gems/ruby-2.3.7/bin/rdebug-ide:23:in `<main>'
gems/ruby-2.3.7/bin/ruby_executable_hooks:24:in `eval'
From the stack trace output, we can determine the state of the system at the time of the error. This will help us recreate locally.
We can ignore the rest of the output where the file path includes the word gems. This is part of the underlying Ruby architecture and less likely to be the source of the problem.
A quick search on Google or Stack Overflow provides you with a confusing amount of tool choices to debug your Ruby code. I’ve listed the most popular debuggers below:
Which debugging tool you choose depends on the problem you’re trying to solve and your personal preference. For a solo project or small team, using puts and inspect may be the quickest solution for a one-off problem. If you’re working on a large team, using a text editor or IDE and ruby-debug-idewould be a good choice.
The best solution is the one that you’re most productive in. Try each one to find the best fit.
The rest of this post will focus on debugging using Visual Studio Code, a text editor created by Microsoft. In debug mode, this application has the best layout of information as well as the smallest learning curve. It’s the option I use for most of my projects, and others often ask me for the same setup.
This option appeals to those developers with a bias toward a specific toolchain and an integrated development environment (IDE). Examples of these toolchains include using Java with Eclipse or C# with Visual Studio.
However, debugging with Visual Studio Code also has the largest and most complex setup configuration. It’s ideal for large teams worried that debugging code will make it into production. It’s also useful when the upfront cost of configuration is worth the time. Others who prefer using a text editor rather than the command line for debugging may also find this solution easier to use.
Most programming languages come with a built-in mechanism for connecting to the running application on a debug port. With Ruby, this functionality is enabled by using the ruby-debug-ide gem.
Install the ruby-debug-ide gem using the gem install command:
gem install debase
gem install ruby-debug-ide
Start your Ruby program by replacing the ruby command with rdebug-ide:
rdebug-ide app.rb
Unlike many other runtimes with built-in debuggers, running this command won’t start the Ruby application. The debugger will pause until a client attaches on the default port of 1234.
Fast Debugger (ruby-debug-ide 0.6.1, debase 0.2.2, file filtering is supported) listens on 127.0.0.1:1234
Debugging frameworks requires a little more configuration. The syntax is slightly different when running an executable instead of passing the Ruby file as an argument directly. Setting the host to 0.0.0.0 will allow the client to attach a port on all interfaces. This allows the command to successfully run locally or in a Docker container.
rdebug-ide --host 0.0.0.0 --port 1234 --dispatcher-port 26162 -- bin/rails server
The most popular Ruby extension available for Visual Studio Code is named Ruby.
Most importantly, this extension comes with debug definitions covering the default ruby-debug-ide client setup, along with loads of other great features.
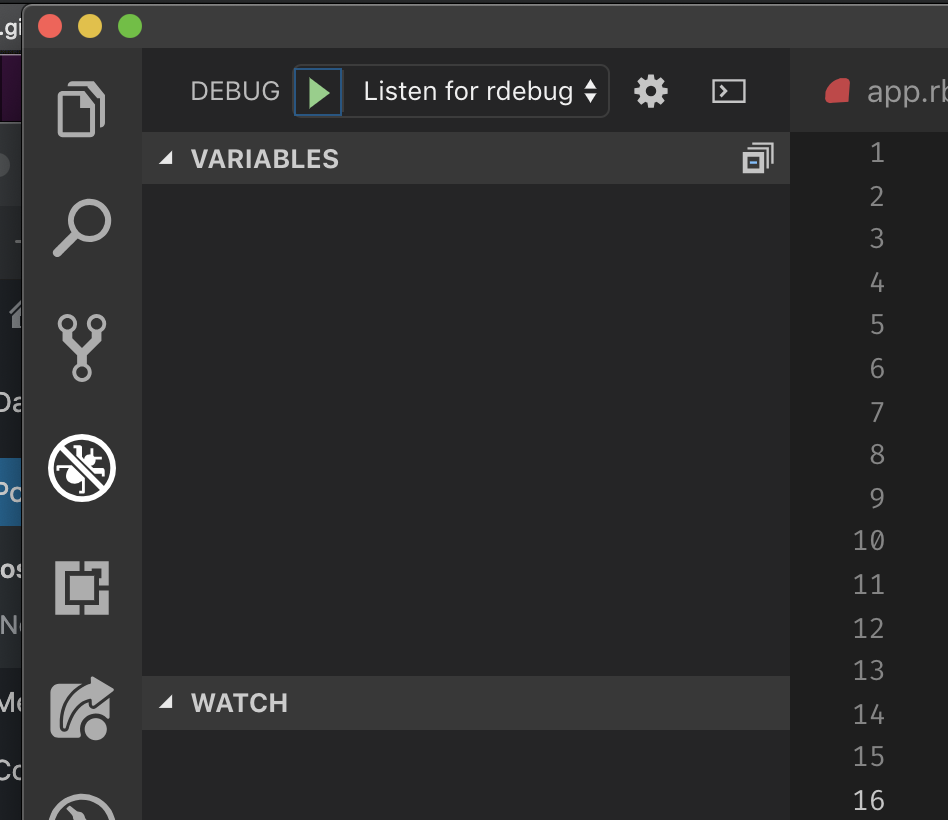
To set up Visual Studio Code to connect to ruby-debug-ide, change to the debug view (F5), press the config wheel, choose Ruby, and then choose listen for rdebug-ide. (See below.)
This will open the launch.json file containing the debug configuration below:
{
    // Use IntelliSense to learn about possible attributes.
    // Hover to view descriptions of existing attributes.
    // For more information, visit:
    // https://go.microsoft.com/fwlink/?linkid=830387
    "version": "0.2.0",
    "configurations": [
        {
            "name": "Listen for rdebug-ide",
            "type": "Ruby",
            "request": "attach",
            "remoteHost": "127.0.0.1",
            "remotePort": "1234",
            "remoteWorkspaceRoot": "${workspaceRoot}"
        }
    ]
}
Visual Studio Code uses this configuration to connect, as a client, to the debugger. This file is autogenerated with the defaults required for connection and shouldn’t need to be altered.
A good first breakpoint to start the investigation is on the line that initiated the error. The following is the first two lines of the stack trace from earlier in this post.
undefined method `id=' for #<User:0x00007f908847b1c8 @name="bob">
app.rb:5:in `<top (required)>'
Line 5 of the code in the file app.rb, displayed above as app:5, caused the issue. To set a breakpoint in Visual Studio Code, click on the sidebar next to the line you want to debug. It’s useful to understand the state of the application just before the error. So place the breakpoint on the line before the error occurred. In the case of the above output, that would be line 4. When you’re ready to start debugging, press the play ▶️ button. The debugger will then start execution and stop on line 4. If everything is set up correctly, you should see something in your Visual Studio Code screen like this:

The above sidebar displays the state of the variables at the point the debugger stopped, on line 4, but it doesn’t execute that line. The bar at the top allows navigation of execution of code.
If you’re interested in a more in-depth explanation of this, check out this explanation of how to use the debug controls by the Microsoft team behind Visual Studio Code.
In many cases, the root cause may be simple. In other cases, it may require a more in-depth investigation. Try the following to help uncover the cause of your error:
Finding the root cause leads to a deeper understanding of how this code fits within the system as a whole. And having a better understanding of the code will improve the quality of the solution. That equates to an increasingly robust codebase.
However you choose to debug your Ruby program, the goals of debugging are to
The steps to achieve these goals are:
Once the root cause is clear, add a test for that scenario and implement the solution.
Using a methodical approach like this encourages pragmatic solutions—and there will be fewer panicked calls from the customer in the middle of the night!

Stackify's APM tools are used by thousands of .NET, Java, PHP, Node.js, Python, & Ruby developers all over the world.
Explore Retrace's product features to learn more.


