Web application monitoring tools can keep your business afloat. Period.
Imagine this. You’re about to run a crucial end-of-season sale on your website. You’ve sent your emails, run social media campaigns, paid for advertisements, and stocked up your inventory; you are all set to let the cash register ring.
However, on D-day, your website goes down. It’s unable to handle the incoming traffic or is simply down because of technical glitches. Your visitors and followers feel cheated, and a change in their attitude towards your business is costing you its existence.
While this is one of the worst-case scenarios, there are instances where your app stalls in performance, offers a poor experience to a few users, throws in bugs, causes problems when checking out, and more. Statistics reveal that even a second’s delay in your webpage or application load time could reduce your page views by approximately 11% and consumer satisfaction by around 16%.
From a business perspective, this is lethal. So, how do you ensure your website or web application is up 24/7? How do you make sure your visitors have the most wholesome experience on your website?
Well, this is where web performance tools come to the rescue. Designed to offer you insights on app performance metrics and relevant tools to assess the performance of your website or web application, they ensure your service or portal is perpetually optimized for optimum customer experience.
To understand in detail what web application performance tools are, let’s explore it further.
Every web application has a set of critical indicators that reflect its performance at any given point in time. Web application performance monitoring tools help monitor such indicators to ensure that the web app performance is consistently maintained at optimum levels. Some of the indicators that are monitored include:
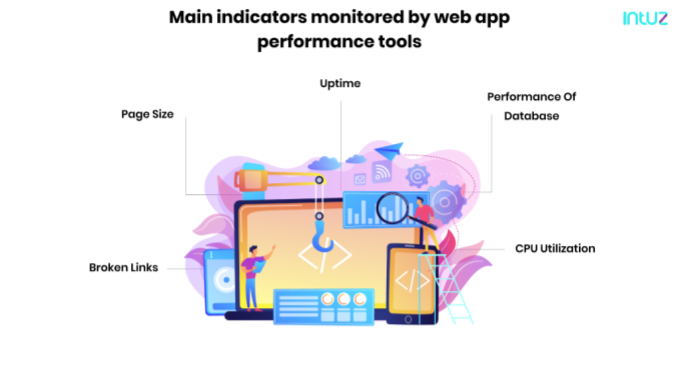
With the help of monitoring tools, you can make your apps load faster, have cyclical hygiene checks, replace heavy graphical images and visuals with less heavy files, declutter content and do more. Web application monitoring ensures your customers seamlessly get their job done.
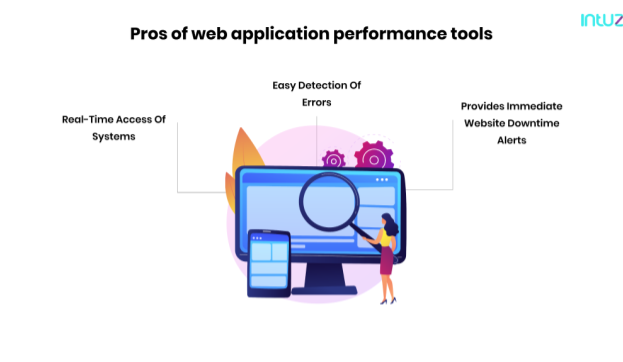
Your tech infrastructure, its network and your deployed web application is always kept under a check (or rather supervision). Consistent reviews and analysis happen all the time, ensuring organization of your tech resources. Thanks to this, system speed, utilization of RAM, server accesses and more are optimized, which in-turn check in real time any problems that may spring up and offer preventive solutions to stop breaches and exploitation of vulnerabilities.
Because the systems are always monitored for anomalies and errors, reports are constantly generated at the backend. Also there are some automation-based web testing tools which can detect glitches easily. You can retrieve them anytime and look for patterns and understand the source of attacks or bugs. With such reports, you can come up with action plans for problems and deal with them more efficiently.
Web application downtime can be harmful to your business. That’s why having more than one check to supervise web app performance is always recommended. With web app monitoring tools, you can have instant alerts when your web app is down or even get a notification about probable downtimes.
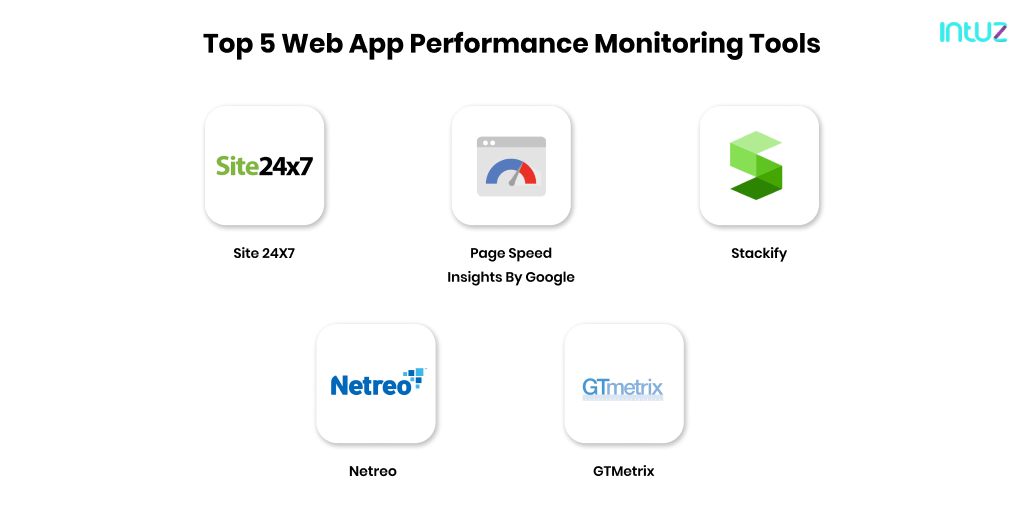
One of the most prominent app monitoring tools, Site 24X7 ensures your application is optimised for performance all the time. As the name suggests, monitoring happens perpetually. With this tool, you can easily understand the behaviour of your application and close any disconnect between how your application is perceived by your users and how your app actually performs. The best part is that it is compatible with an array of platforms such as .NET, PHP, Ruby, Node.js and more.
We recommend Site 24X7 because:
This one is for the non-technical entrepreneurs and solopreneurs who want to have a fast-loading and functional website running without much technical expertise.
Powered by Google, you can use this tool to understand the performance of your website. Page Speed Insights considers several parameters to show you results about your website and you can choose to test both backend modules and on-page features with the tool. Apart from being descriptive, it is also prescriptive by suggesting fixes and recommendations to any concerns your website may be experiencing. This is ideal for anyone who wants their websites to be on the good books of Google search engine.
Stackify is the ideological opposite of Page Speed Insights. This one is specifically built keeping developers in mind. With this performance monitoring tool, you can improve code, troubleshoot issues, find bugs, optimize web app performance and more.
One of the standout features of Stackify is that when deployed, it automatically pulls information about all the apps on your server and initiates monitoring processes. It sends instant alerts and notifications to concerned teams whenever concerns arise. Similar to Site24X7, Stackify also supports apps built across frameworks and languages like Ruby, PHP, .NET, Node.js and JAVA.
Netreo, the company behind Stackify, also has best-in-class web application response time functionality included in its full-stack monitoring platform. The Web Application Response Time Monitor (Web ART) is designed to allow IT organizations to get a realistic view of user experience and easily identify the source of performance slowdowns.
By using a simple wizard-based web configuration, the Web ART software allows administrators to configure complex multi-part web transactions, including multipart forms and authentication, and benchmark each step individually. DNS lookups, TCP connections, and HTTP transfer times are recorded individually and proactive alerts can be configured based on any individual component, or on total transaction time. Multi-part tests allow administrators to define dependencies, follow on-page links, define regular expressions to match in the results, and receive alerts when any step in a transaction returns an unexpected failure.
Another popular performance monitoring tool, GTmetrix makes way for a comprehensive analysis and testing of your app or website. The good aspect is that you can get a free test done for your portal, where performance across key parameters (PageSpeed and YSlow scores) are calculated from across 25 global servers and are delivered as results for you to study and understand.
It has visualizations of reports for better comprehension and interesting videos to understand customer perspectives as well.
Besides the tools we have mentioned, there are plenty of other performance monitoring tools in the market. Every tool is unique in its offerings, and comes with advantages and disadvantages. Choosing the right tool completely depends on your business vision and app requirements.
The main purpose of utilizing such tools is to understand the problems and symptoms of why your app is not performing the way it is supposed to. Despite the countless hours you put into building and promoting it, why hasn’t it garnered more attention? What is going wrong, or better, where is it going wrong?
The tools will provide answers to such questions and depending on the questions you ask, the right tool will fall into place.
Your website or app can be optimized for ultimate performance in days with the use of monitoring tools. As you clearly define your goals, you will have more relevant indicators and metrics to keep your app’s performance at levels to outdo your competition.
Stackify's APM tools are used by thousands of .NET, Java, PHP, Node.js, Python, & Ruby developers all over the world.
Explore Retrace's product features to learn more.


