Over recent years, the term APM has become increasingly used by lots of vendors and tools. Some refer to it as Application Performance Monitoring and some as Application Performance Management. But what is the difference? As the founder of a company who creates these types of tools, I definitely have some opinions on Application Performance Monitoring vs Application Performance Management. It’s important to know the difference if you are planning to use an APM tool to troubleshoot app issues and need more visibility into performance bottlenecks.
I think you could broadly define it as anything that has to do with monitoring the performance of a website or application. For example, there are tools that do nothing but check your website every minute to see if it is online and how long it takes to load. I guess you could say this is the absolute simplest form of application performance monitoring.
However, a simple HTTP ping type check is hardly enterprise grade or advanced application monitoring. It might be able to tell you that your site is down or slow, but you would have no idea why.
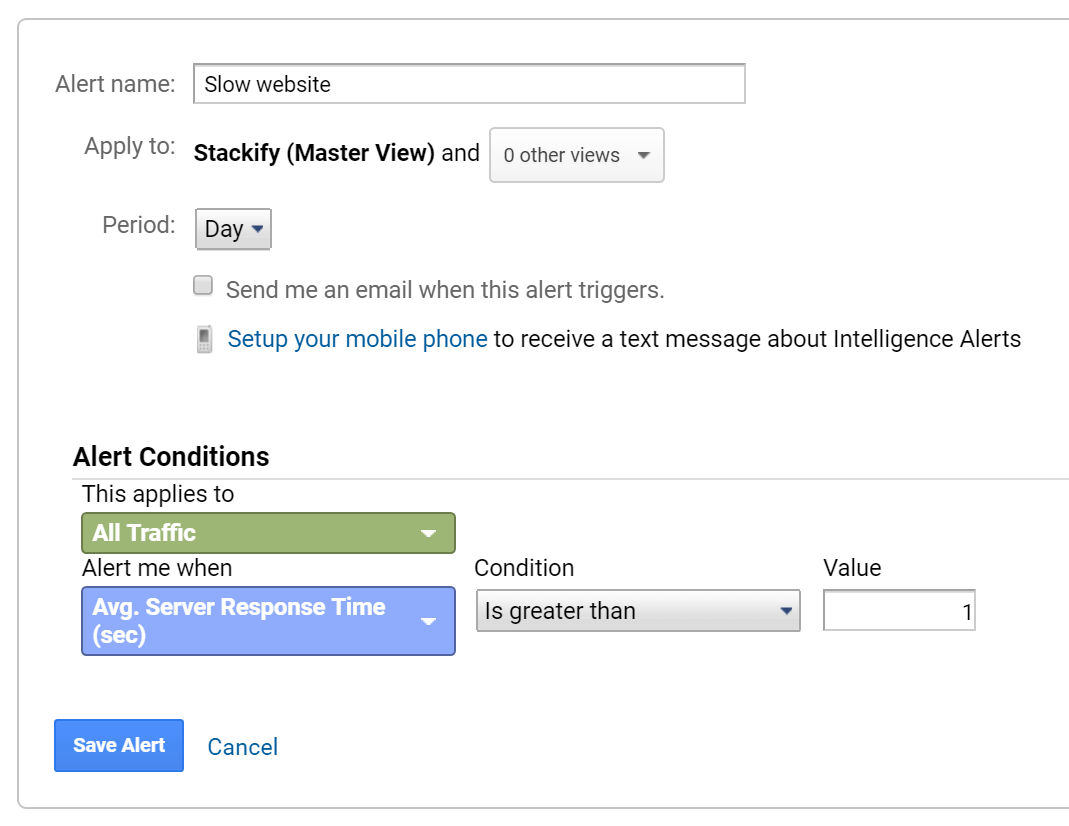
Yes, believe it or not, you could just use Google Analytics to alert you when your site is so slow.
The problem with most of these strategies is they don’t tell you WHY your app is down or slow. They are merely alerting mechanisms to tell you there is a problem.
Like anything in life, identifying a problem is relatively easy. Knowing about the problem is no doubt very important and these tools can help.
That said, solving the problem is where all the hard work lies. Solving the problem takes a lot more insight, data, and tools.
Hopefully, you can see why the term application performance monitoring can be used to mean pretty much anything. It is an umbrella term used to describe a wide range of tools that alert you about potential application problems. Unfortunately, they typically only tell you that a problem exists and don’t understand the full context of what is going on across your entire environment.
The first big key difference is being application aware and focused. Most application performance monitoring tools measure performance in one way or another but they rarely understand the full context of the application itself.
For example, checking if https://stackify.com works or not can only tell you if the site is up or down. It has no context that the site might be running across a dozen load balanced servers.
Most APM solutions automatically discover and help you track all of your applications across all environments. Including pre-production and production environments.
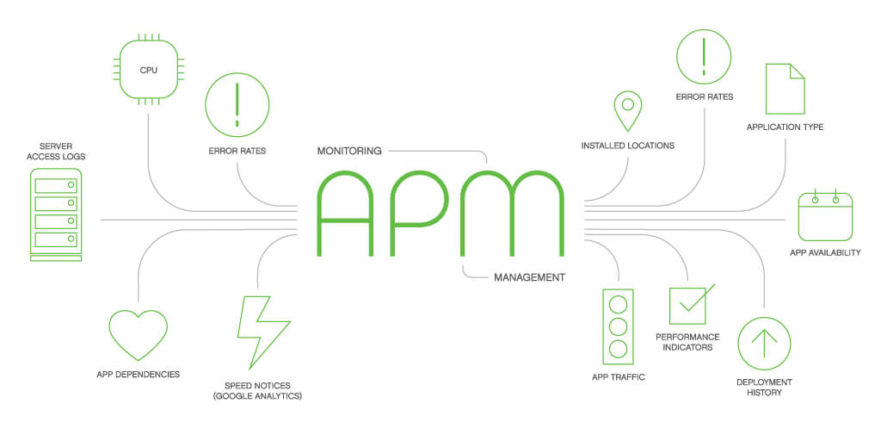
There are several things that development teams need to track and manage their applications:
These details are important to help developers understand what is going on with their applications. Thanks to the DevOps culture and affordable APM solutions, development teams finally have the tools they need to manage their applications.
Most Application Performance Management solutions also include code level performance data. The only way to identify slow SQL queries, long running web service calls and other common problems is to profile the code itself.
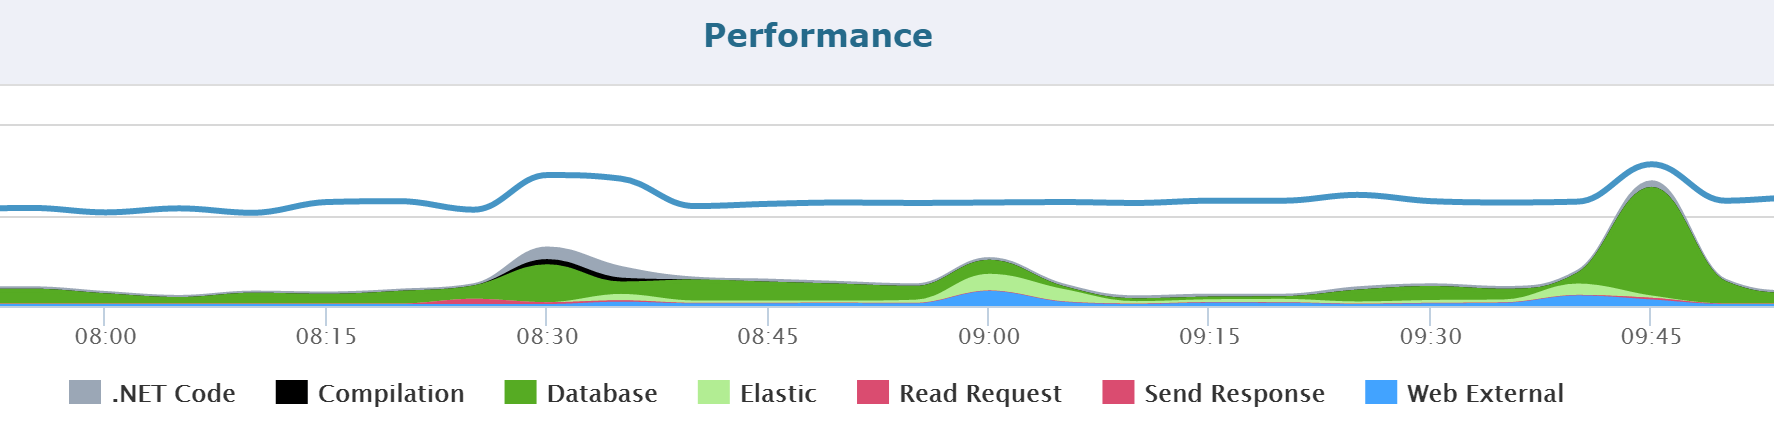
Most solutions, like Retrace, automatically track the performance of all common application dependencies and frameworks. Common dependencies like SQL, MongoDB, Elasticsearch, Redis, and many others are automatically recognized and tracked. This makes it really easy to quickly identify performance problems in your application stack.
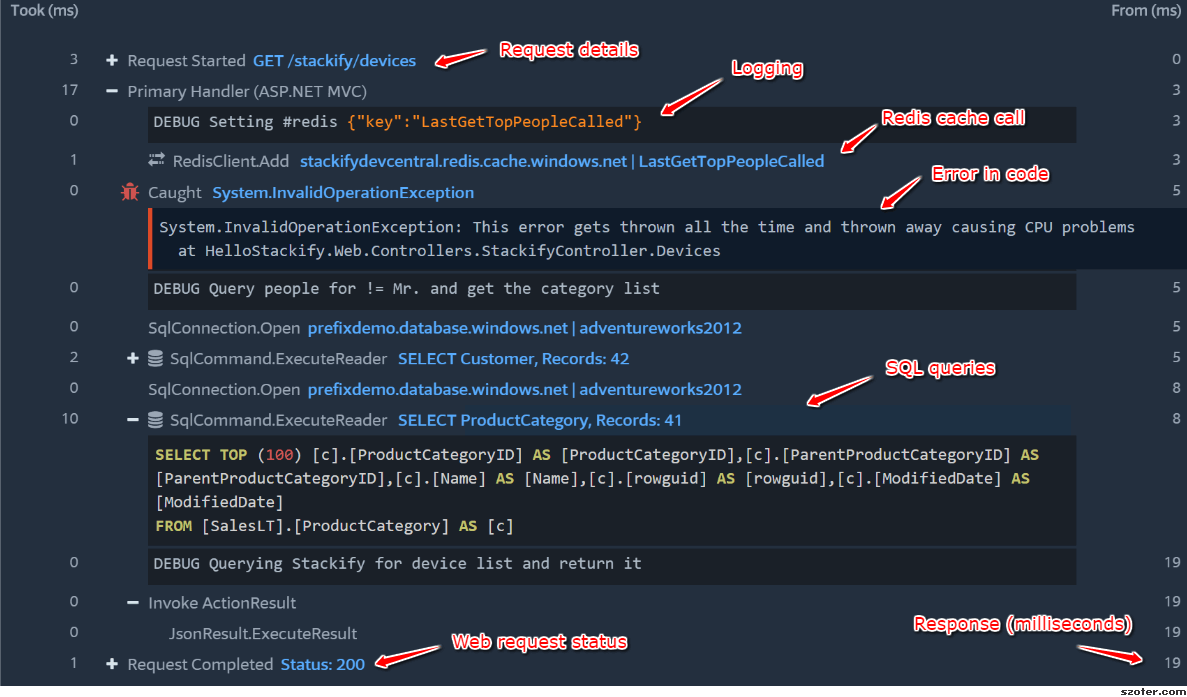
Understanding performance down to the code level also makes it possible to literally visualize what your code is doing as well. Most APM solutions can capture snapshots or traces of individual transactions. You can then review those to visualize what your code is doing. This helps developers get down to the low-level details that they need to know what their application code is doing.
I would argue that application performance monitoring is part of application performance management. There is no real debate of application performance monitoring vs application performance management. Many of the monitoring tools and capabilities are simply features of a larger application performance management strategy.
Our product, Retrace, provides a holistic view of all the data developers need in one place. Developers can quickly access server & application metrics, application errors, logging, and even code level performance data. Developers can “Retrace” what their code is doing to quickly identify problems and opportunities for improvement.
Stackify's APM tools are used by thousands of .NET, Java, PHP, Node.js, Python, & Ruby developers all over the world.
Explore Retrace's product features to learn more.


