Retrace is an an award-winning, easy-to-use SaaS application monitoring solution, combining APM reporting with Error and Log management in a centralized location. The main APM component of Retrace provides code-level application performance visibility for 6 of the most popular programming languages, .Net, Java, PHP, Python, Ruby and Node.js. Retrace APM metrics give users insight into the amount of requests that are being made to an application’s endpoints and how those requests perform.
In this post, we are going to cover the basics of Retrace APM from installation and configuration to APM reporting. We’ll also include basic troubleshooting steps for the most common issues users encounter once Retrace APM reporting is set up. So read on and learn why so many others are using Retrace to ensure a great user experience for all their applications.
Retrace is pretty easy for beginners, and our knowledge base has a collection of documentation to help guide your way. Simply install Retrace on your Windows or Linux server and configure your application to begin reporting to your Retrace account.
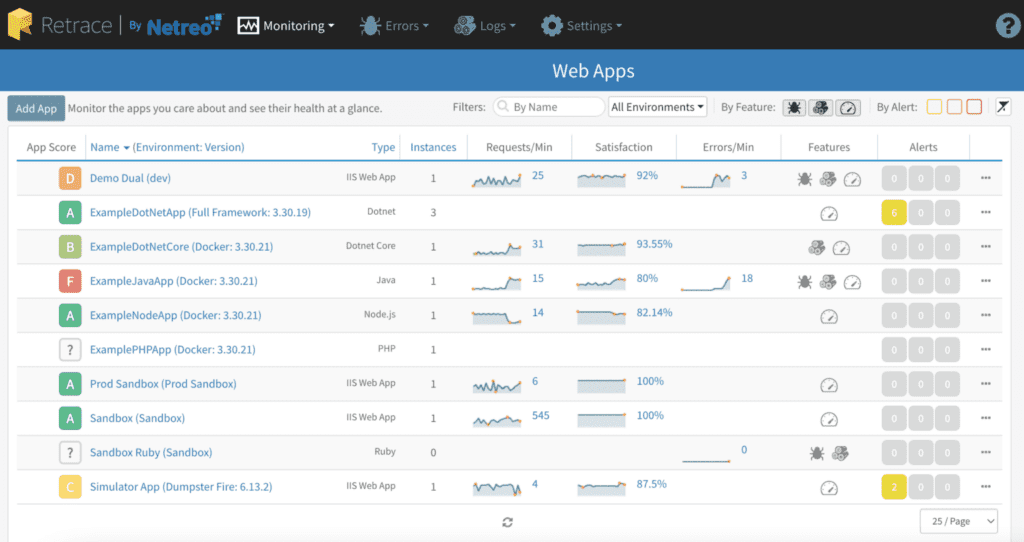
When configuring a .Net application, for instance, a simple JSON document called the Stackify.json is created. In this file, you name your application and its environment as you would like it to appear in your Retrace account and simply save it to the root of your application. Once the Retrace agent is installed and running on your server and the configured application, the application begins reporting on the Web Apps Dashboard of your Retrace account.
Now that the application is reporting to the account and traffic is flowing through the application, Retrace begins uploading the performance of those requests. This data will include specific timings from those requests, corresponding to average load time, database, queue, redis and more. Retrace also breaks down those requests related to their type, such as server side, client side (if you are using Retrace’s RUM feature), external web service calls or tracked functions. Additionally, Retrace reports individual traces from that APM data.
Retrace APM data is especially useful when evaluating how an application is performing. Having the ability to see how many requests an endpoint has reported over a time period is just the beginning. Knowing how those requests actually performed beyond just how many times an endpoint was requested is key. Retrace summarizes the count of requests to an endpoint, calculates the timings of each request and reports average total page load times, database load times called from those requests, how long redis calls took, storage and web external timings. The value of knowing these pieces and pinpointing which “portion” contributed to slower overall load times is critical. Captured metrics enable developers the information to improve the performance of their code in a practical manner.
Retrace also reports the performance of certain requests to your application as a Trace. These traces are sampled by Retrace. Retrace reporting traces 1 to 1, that is, 1 trace per 1 request that is submitted to the application, Retrace monitors request performance to an endpoint and reports them as traces based on their context. Samplings include whether a trace was faster or slower than normal or if a request introduced a new SQL or exception. When an app is receiving steady traffic, Retrace reports endpoint traces every 5 to 15 minutes.
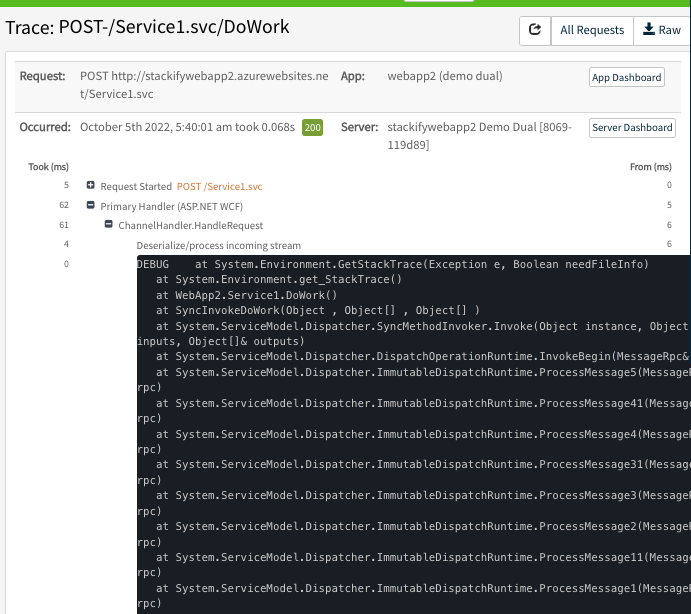
Trace details are included for all traces reported in Retrace. Details are a comprehensive list of the timing of each step that took place during the request cycle. With traditional APM tools, these timings are for the server side tasks taking place during the request. Retrace’s RUM feature provides traces for the Client side information. Trace details will include information for the request start, primary handler, SQL connections and calls, exceptions, json results and more. Each trace highlights problem areas in your application, plus a general summary on the average performance of the requests.
Retrace is generally easy to install and configure, but occasional issues will require troubleshooting. Some of the most common issues our Support Team encounters are also the easiest issues to troubleshoot. That being said, our team is always happy to help with any issues you encounter.
Lack of application traffic is the most common APM issue, though it’s not really an issue at all. Once your application is configured and reporting to Retrace, you’ll want to ensure traffic is going to the endpoints. Without traffic, Retrace won’t have any information to report to your dashboards.
This is sometimes mistaken for misconfiguration or other issues with Retrace. However, there is usually a slight delay in seeing APM data once you add a new application to Retrace. As long as you have traffic flowing through the application, Retrace will report APM data in 10 to 15 minutes. Once data is reported to the UI, the delay becomes shorter and typically appears within about 5 minutes.
The next most common issue we see with APM reporting is IIS was not restarted after configuring applications to monitor. Restarting IIS is imperative for Retrace to operate correctly. IIS enables the Retrace profiler to attach to your application and track raw trace data. That data is then compiled and uploaded to the Retrace UI for application performance monitoring. This issue is easily resolved with a quick restart of IIS on the server.
The last common issue we see quite often is referred to as a CoCreate instance. Specific to Windows installations, a CoCreate instance is encountered when the profiler attempts to attach, but the .Net framework refuses. This means that more than one APM tool has been installed on the server. Due to Microsoft’s strict policy of a single profiler installation on a server, the conflict prevents Retrace from working properly. Unfortunately, the only way to resolve this issue is to uninstall both tools. Then reinstall Retrace, restart IIS to clear up the conflicts and Retrace’s profiler will successfully attach to the application.
While only a few examples of common issues that we see when APM is not reporting, other possible issues may impact Retrace APM reporting. However, no matter what the issue, our Customer Success Team is always here to assist with any issues you encounter.
If you would like to hear more about what Retrace APM can do for you, check out our All Systems Go! user group session videos, now available on YouTube. Better still, take a Retrace test drive today!
Stackify's APM tools are used by thousands of .NET, Java, PHP, Node.js, Python, & Ruby developers all over the world.
Explore Retrace's product features to learn more.


