
OpenTelemetry was launched in May 2019, as a merger of the OpenCensus and OpenTracing projects. The open-source, vendor-neutral project resides within the Cloud Native Computing Foundation (CNCF), which virtually ensures its longevity and widespread adoption. In fact, OpenTelemetry has gained significant traction in recent years, with support from many major cloud providers and the tech industry.
The ongoing, rapid adoption of cloud-native architectures has also created an urgent need for standardized observability protocols. OpenTelemetry is quickly becoming the preferred option for distributed tracing, metrics and logging in cloud-native environments. With an active community of over 400 individuals and 80+ contributing organizations, the projected growth rate of OpenTelemetry remains high.
Transitioning to OpenTelemetry can be a major undertaking for any organization. To minimize costs and risks, testing OpenTelemetry on your own developer desktop is highly recommended before scaling up. Conducting tests in a development environment enables you to experiment with various configurations and settings, determine use cases, prioritize applications and build a strong case for implementing OpenTelemetry.
Tools such as Jaeger, Zipkin and Stackify OTel Prefix allow you to visualize traces and other telemetry data from your applications. But these tools have differences in how they work and what they offer. Jaeger and Zipkin are distributed tracing systems that support OpenTelemetry. They allow you to collect, visualize and analyze traces to improve troubleshooting in your distributed systems. Jaeger also provides a UI for exploring traces and a set of APIs and SDKs for instrumenting your applications.
OTel Prefix is a lightweight tracing tool that enables you to quickly and easily visualize traces from your local applications without setting up a full distributed tracing system. OTel Prefix provides a simple, yet powerful UI for exploring traces and supports several tracing formats, including OpenTelemetry.
The primary distinction among Jaeger, Zipkin and OTel Prefix lies in the degree of functionality and intricacy. While Jaeger demands more setup, configuration, time and resources, which translates to higher expenses, it only furnishes span-level data and is restricted to a maximum of 10,000 spans. Its trace view delivers fundamental information and timings, with little additional value.
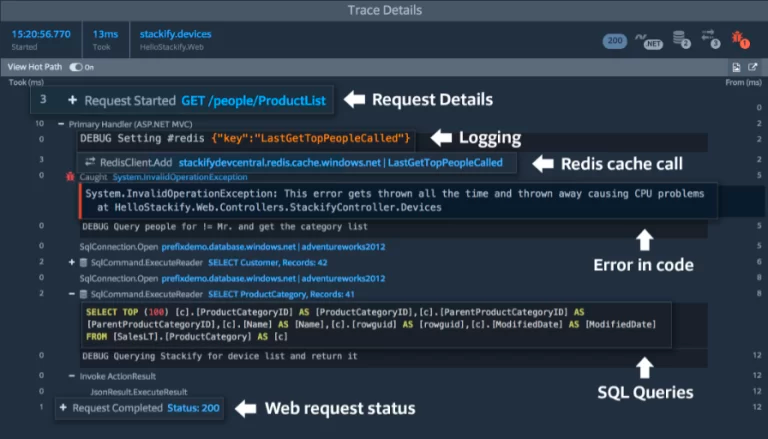
On the other hand, OTel Prefix shows and highlights more information over the same data and provides dashboards and aggregations that are useful. OTel Prefix presents at the trace level rather than the span level and also displays distributed transactions better. A more straightforward, simple-to-use tool, OTel Prefix provides comprehensive visibility into traces for local debugging and testing.
If you are just starting with OpenTelemetry and looking for a simple yet effective solution for local tracing, OTel Prefix is a great choice. Once you have tested your initial use cases and verified them with Prefix, you will have greater confidence in making more substantial investments and moving forward with OpenTelemetry.
Here’s how you can get started with OpenTelemetry today with Otel Prefix.
To install Stackify by Netreo’s OTel Prefix, follow these steps:
# otel-collector.yaml

processors:
 batch:
   send_batch_size: 1000
   send_batch_max_size: 2000
   timeout: 1s

exporters:
 otlp/prefix:
   endpoint: host.docker.internal:7134
   tls:
     insecure: true
     insecure_skip_verify: true

service:
 pipelines:
   traces:
     receivers: [otlp]
     processors: [batch]
     exporters: [otlp/prefix]
   logs:
     receivers: [otlp]
     processors: [batch]
     exporters: [otlp/prefix]
Once you have configured your application to use the Stackify by Netreo .NET APM agent, you can use Prefix to monitor and troubleshoot your application’s performance. Prefix provides a range of tools for profiling and analyzing your code, including real-time performance metrics, call graphs and Database Query timings. You can use Prefix to identify performance bottlenecks, optimize your code and improve your application’s overall performance.
How do I Integrate OpenTelemetry in .NET Using OTel Prefix?
To integrate OpenTelemetry in .NET using OTel Prefix, first, make sure you have the necessary NuGet packages installed:
Then you can edit your Program.cs to use OpenTelemetry. This example uses the minimal API to set up OpenTelemetry (though you can do this in other ways).
// Program.cs
using Microsoft.Extensions.Hosting;
using Microsoft.Extensions.Logging;
using OpenTelemetry;
using OpenTelemetry.Exporter;
using OpenTelemetry.Logs;
using OpenTelemetry.Resources;
using OpenTelemetry.Trace;


// common resource used in configuring logging, traces or metrics
var resource = ResourceBuilder
   .CreateDefault()
   .AddService("My Application")
   .AddTelemetrySdk()
   .AddEnvironmentVariableDetector();


using var host = Host.CreateDefaultBuilder(args)
   .ConfigureLogging((context, builder) =>
   {
       builder.AddOpenTelemetry(options =>
       {
           options.SetResourceBuilder(resource);
           options.IncludeFormattedMessage = true;
           options.ParseStateValues = true;
           options.IncludeScopes = false;
           options.AddOtlpExporter(opts =>
           {
               opts.Endpoint = new Uri("http://localhost:4318/v1/logs");
               opts.Protocol = OtlpExportProtocol.HttpProtobuf;
               opts.ExportProcessorType = ExportProcessorType.Batch;
           });
       });
   })
   // add services
   .ConfigureServices((context, services) => { })
   .UseConsoleLifetime()
   .Build();


// add Open Telemetry tracing
using (var provider = Sdk.CreateTracerProviderBuilder()
          // add custom sources defined in your own app or in 3rd party libraries here
          .AddSource("MyApplicationSource", "Npgsql")
          .SetResourceBuilder(resource)
          // add additional instrumentation here
          .AddHttpClientInstrumentation()
          .AddOtlpExporter(opts =>
          {
              opts.Endpoint = new Uri("http://localhost:4318/v1/traces");
              opts.Protocol = OtlpExportProtocol.HttpProtobuf;
              opts.ExportProcessorType = ExportProcessorType.Batch;
          })
          .Build(host.Services))
{
   await host.RunAsync().ConfigureAwait(false);


   // force sending data prior to full shut down
   provider.ForceFlush();
}
In this code, we are creating a common resource that defines the application and resource for logging and traces. We then add Otlp logging output to the collector. After building the host, we create a tracing provider. Inside the creation of the tracing provider, we add our shared resource and instrumentations and finally the Otlp exporter to the collector.
Many libraries are already instrumented with OTel and there are many OpenTelemetry instrumentation packages available from NuGet. Some libraries, like the PostGreSql libraries, build their instrumentation directly into their packages and only require adding an ActivitySource name to capture the instrumentation.
HINT: traceProviderBuilder.AddSource(“Npgsql”) will add PostGreSql instrumentation.
Creating your own custom instrumentation requires a couple of pieces.
First, create an ActivitySource that will be used to generate Activities. Then, add the name of that ActivitySource to your tracerProvider. Finally, wrap the code you want to track in an Activity. From that activity you can add tags, events and links to the activity.
// See previous example of setting up Program.cs for where to add 'MyApplicationSource'

static ActivitySource MyActivitySource = new ActivitySource("MyApplicationSource");


using (var activity = MyActivitySource.StartActivity())
{
   activity?.AddTag("MyTag", "MyTagValue");
}
HINT: It is important to always use the Null check operator when working with Activities. If there is no listener for the ActivitySource, the activity generated from that source will be null.
You can also create your own traces or subtraces with an activity source. Here is an example of creating a sub trace where it’s linked to the parent trace.
using (var activity = MyActivitySource.StartActivity())
{
   activity?.AddTag("MyTag", "MyTagValue");

   Activity.Current = null;
   using (var activity2 = MyActivitySource.StartActivity(ActivityKind.Internal, name:"Activity2",  links: new []
          {
              new ActivityLink(activity.Context, new ActivityTagsCollection())
          }))
   {
       Activity.Current = activity2;
       activity2?.AddTag("MyTag", "MyTagValue");
   }
}
Here you can also see that we’re setting the original activity as the parent trace. This is done by passing in an ActivityLink during creation of `activity2` and will generate a Link in the second trace to the first. This effectively creates a distributed transaction.
To generate a new trace, you need to first set the Activity.Current static property to null. Then, start the new Activity and assign it to the Activity.Current static property. Anything wrapped in the new Activity’s using scope will be part of the new trace.
Affectionately known as the Developer’s Sidekick, Prefix is used by more than 40,000 developers worldwide to release optimized apps faster every day. OTel Prefix delivers unmatched observability across user environments, new technologies, frameworks and architectures to further improve the performance of your apps and your team. Download and experience the extended benefits of OTel Prefix today, for FREE!
Stackify's APM tools are used by thousands of .NET, Java, PHP, Node.js, Python, & Ruby developers all over the world.
Explore Retrace's product features to learn more.


