
Monitoring an application’s performance is one of the hardest challenges in software development. That’s true for virtually any programming language and platform. Java performance monitoring presents some unique challenges of its own.
For instance, one of those challenges has to do with garbage collection. Java features automatic memory management, which frees the developer from having to manually dispose of obsolete objects.

But you know what they say about free lunches. Garbage collection has a cost: too many collections will take its toll on performance.
Garbage collection apart, Java performance monitoring is an ongoing task, so it is important to have the right tools.
And that’s what today’s post is all about. We’re going to cover nine Java performance monitoring tools. Or rather, nine types of performance tools.
After learning about these broads categories, you’ll be able to analyze your particular scenario and decide the right type of tool to suits your needs. Let’s get started.
JVM Profiles offer a ton of raw data by tracking all method calls, allowing you to find CPU and memory consumption hotspots.
A good scaling test is to set up an Apache JMeter job to hit an endpoint you are developing a few thousand times while linked to a profiler. This allows you to spec out memory and CPU requirements for production.
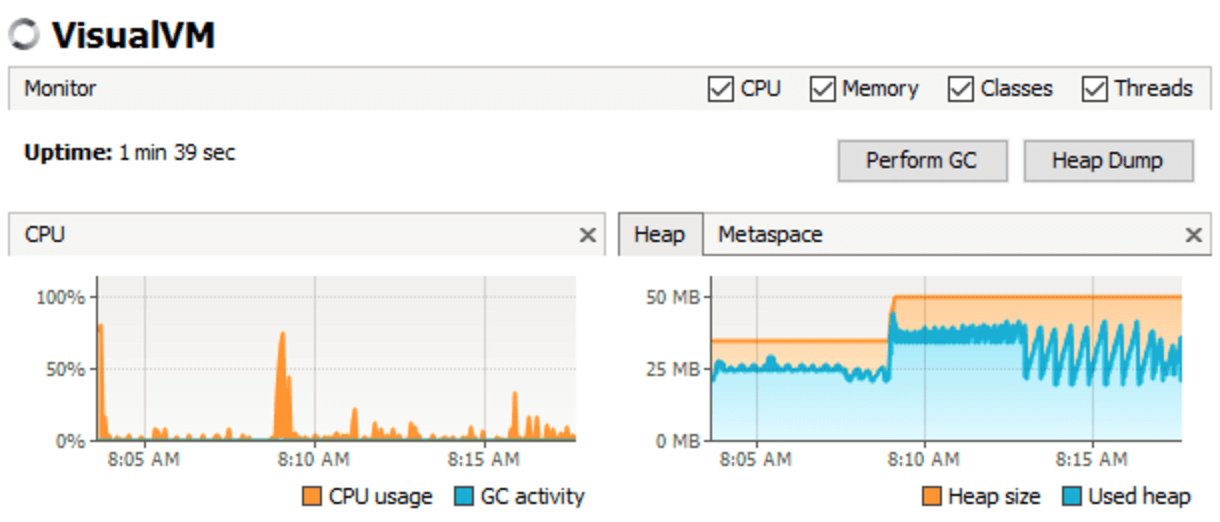
Great for tracking down memory leaks; the ability to manually run garbage collection and then review memory consumption can easily shine a spotlight on classes and processes that are holding on to memory in error.
Requires a direct connection to the monitored JVM; this ends up limiting usage to development environments in most cases. (Note: some profilers can work off thread and memory dumps in a limited fashion.)
VisualVM, JProfiler, YourKit and Java Mission Control.
Standard java profiling tools are focused on the performance of all methods across the entire application. These tools are focused on the performance of individual web requests or transactions.
Prefix provides deep level performance details about your app, including ORM calls with generated SQL, SOAP/REST API calls, and trace details from the most commonly used third-party libraries and frameworks.
XRebel is set up using a Java Agent on your web application’s container and provides an overlay on your application that gives details about the current request.
Tools like Prefix can provide very detailed traces of what your code is doing:
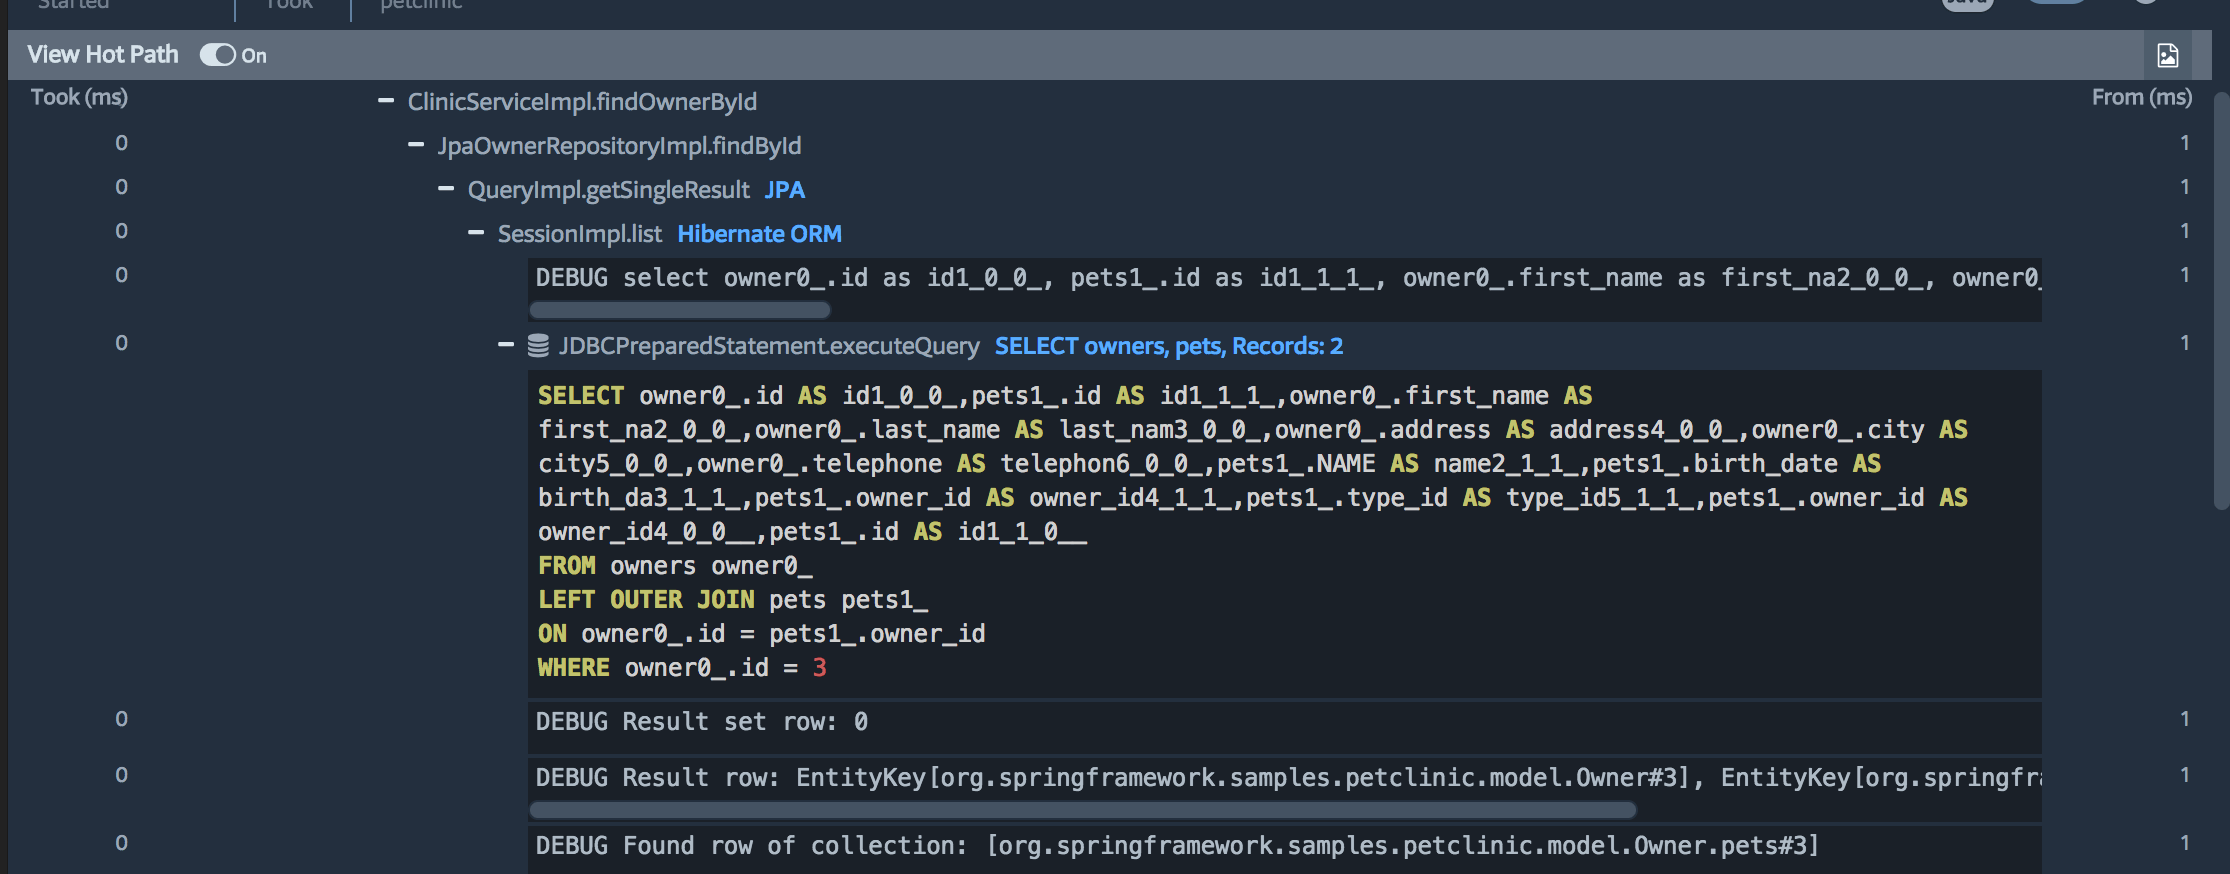
These tools give order to the vast amount of data available in a JVM profiler. By helping you follow the flow of a request, you can see what types of method calls are responsible for your response time.
Designed for the development cycle only. QA and Production environments will require an APM solution.

Application performance management (APM) tools take on the task of tracking all requests on a production system.
The trick with these profilers is to provide the right information in a smart way so as not to impact production performance.
This is done by aggregating timing statistics and sampling traces. This gives you method level visibility to your code that is running in production.
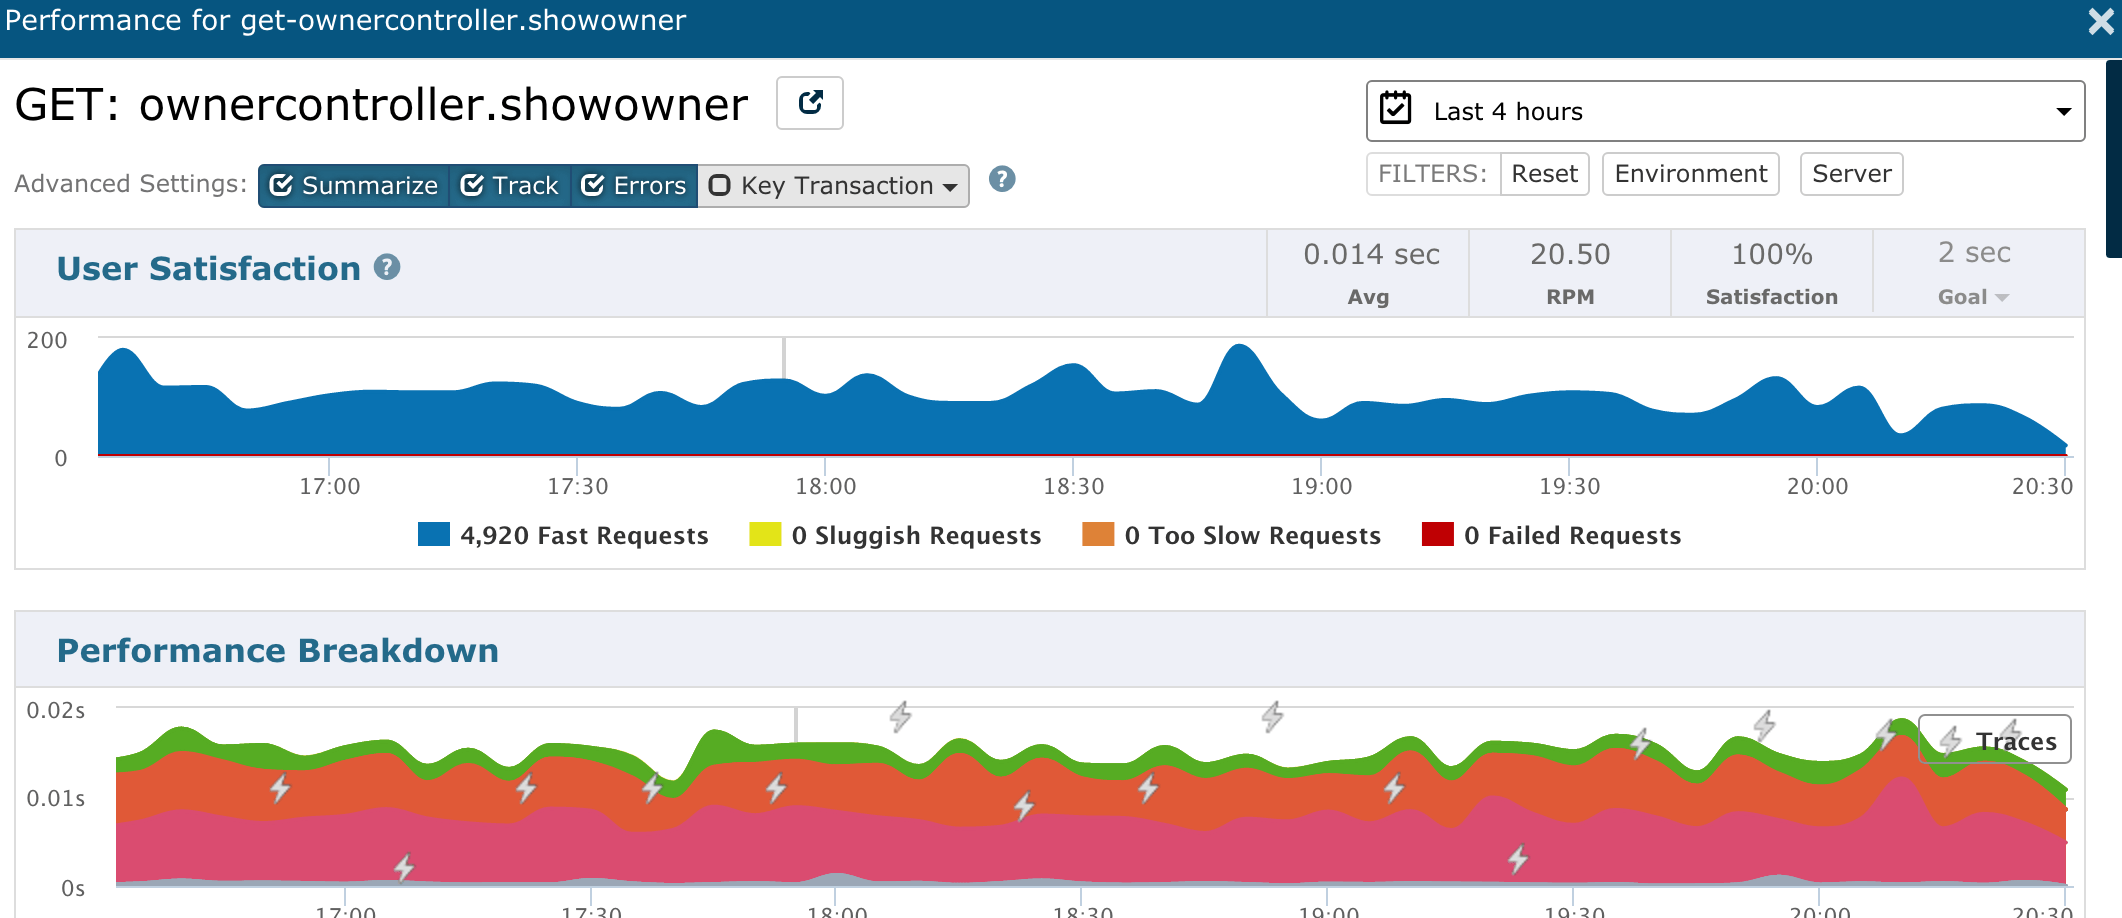
The ability to monitor your most critical environment: Production. The key to perfecting Java performance monitoring is to identify issues before going into production by monitoring QA/Staging. Debug production live by analyzing traces and exceptions. Aggregate summaries to see highly used requests to help focus development time.
Typically expensive to run on all QA/Staging and Production servers. Some tools lack support for async queries or are not tuned properly and slow down your application.
Note: Some providers, including Stackify Retrace, provide free trials that can be used to help identify immediate problems.


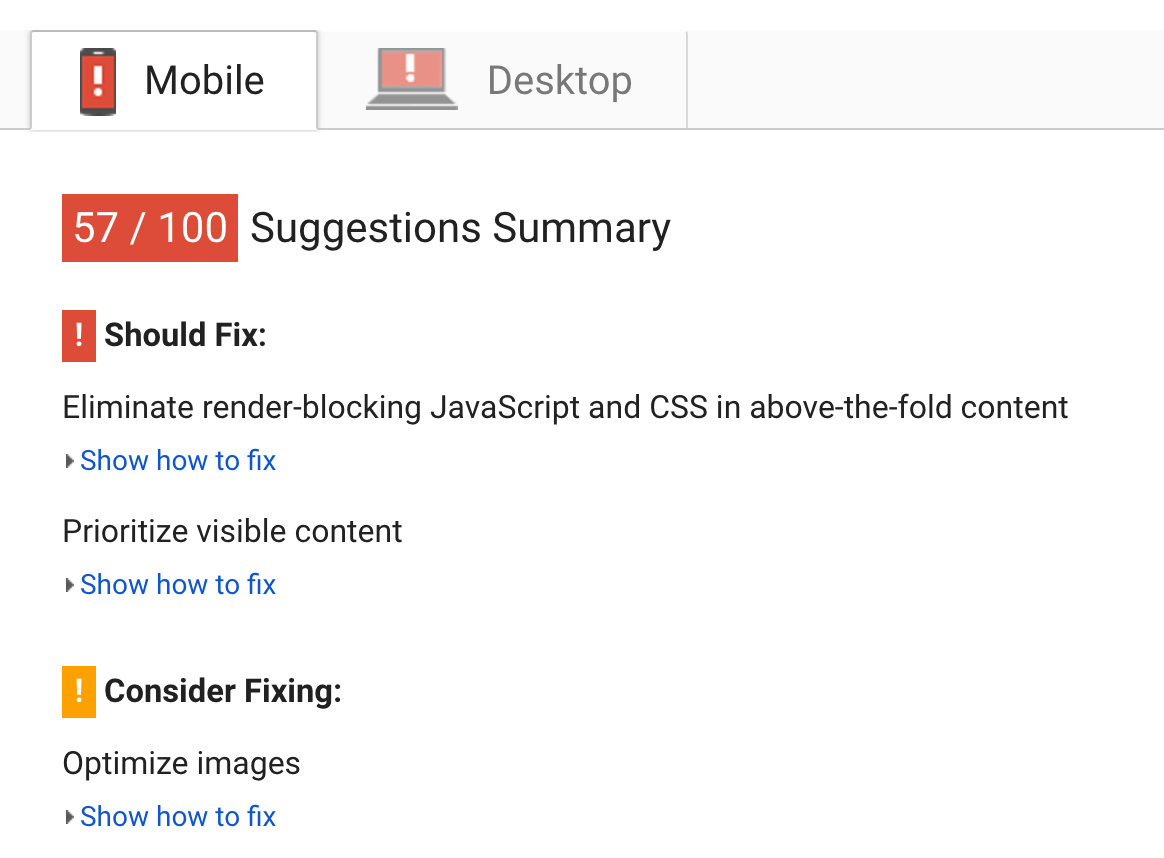
It’s not uncommon for web apps to be very client-side heavy. Therefore, providing an interactive experience can require a good deal of dependencies, such as Javascript/CSS frameworks, web fonts and images.
RUM provides insight into your application’s dependencies by giving visibility to asset download and page rendering time.
Some APM products include this as an additional feature. There are also standalone products, such as Google PageSpeed.
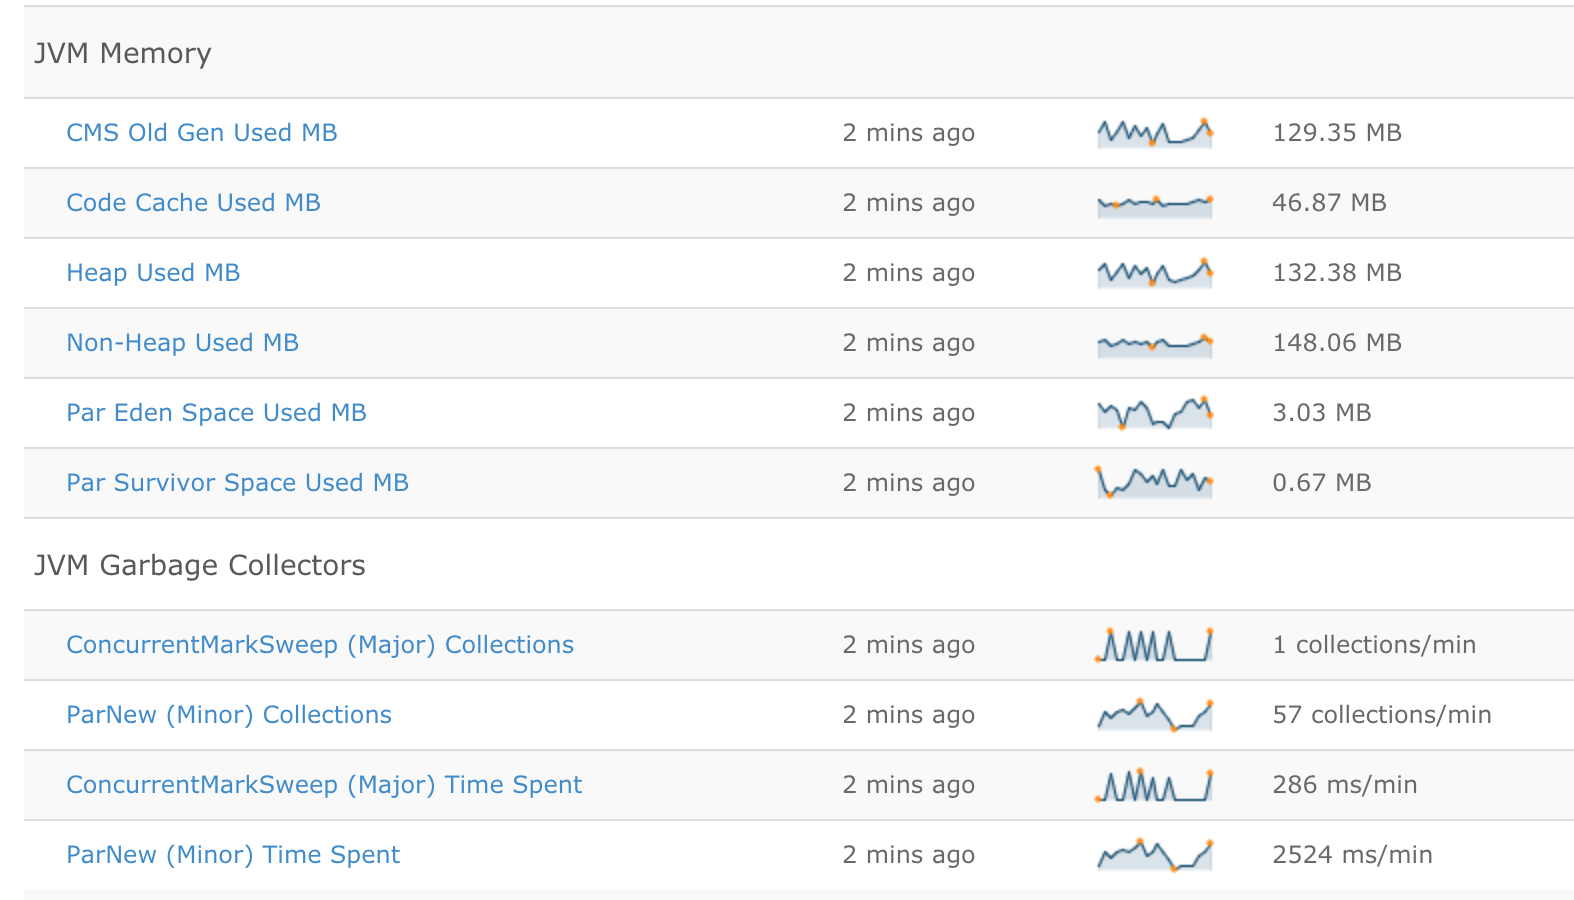
The JVM provides a great deal of valuable information such as garbage collection, memory usage, and thread counts. This data is made available via JMX.
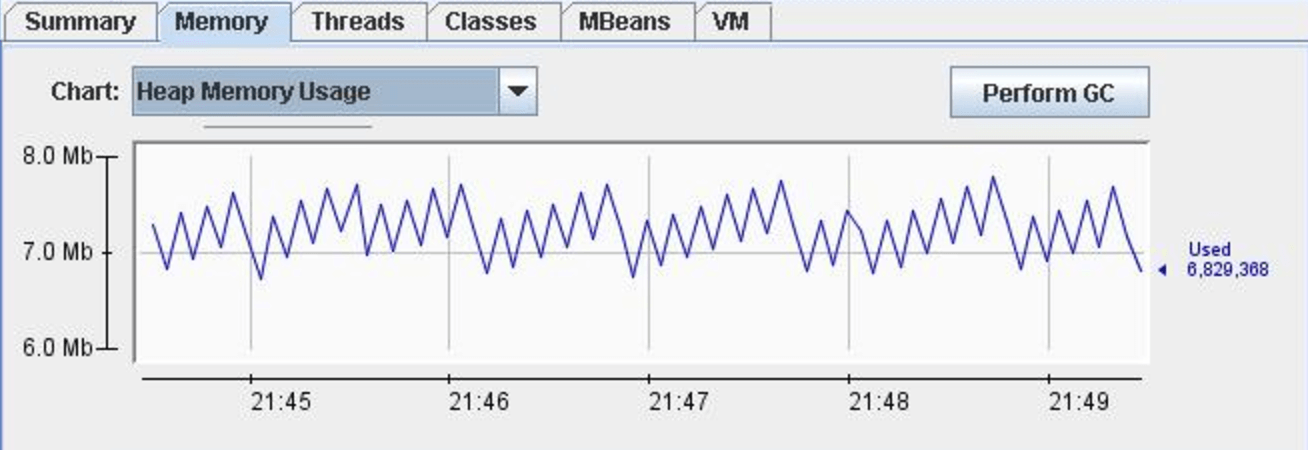
Stackify Retrace provides JVM metric monitoring via App Monitors and automatically applies smart defaults based on the type of application discovered.

Available in any application running on the JVM and easy to connect to with apps such as JConsole.
Can be difficult to connect to in a staging and production environment. Aggregation and comparing data might be time-consuming. Stats are only gathered while the monitor is connected to the JVM.
Java Virtual Machine: Critical Metrics You Need to Track
If you have Apache or Nginx proxying requests to your Java application server, you can monitor access logs. This is a quick way to see how long requests are taking.
You can aggregate the access logs to see what the most popular/fastest/slowest endpoints are. Doing this via the command line can be time-consuming, though.
For small datasets, you can use a desktop tool like Apache Viewer, but for staging and production environments, a hosted logging solution is ideal.
Tracking Failed Requests is also very useful, which can be done by aggregating on HTTP Response Codes.
Quick way to get some simple stats by tailing access logs, or—if more info is needed—push into a log analyzer.
Doesn’t give you any details as to why the request took as long as it did. Lack of POST data and response content that could help point you to the cause of a performance issue.
AWStats and Apache Viewer
ELK stack, Stackify, Splunk, LogEntries
13 Ways to Tail a Log File on Windows & Linux
One of the biggest causes of performance problems can be application exceptions.
When an exception is thrown, it causes the thread to pause while the stack trace is collected. Even handled exceptions that seem innocent can cause huge performance bottlenecks under heavy server load.

It is important to aggregate and monitor all of your exceptions to find critical problems, new errors, and monitor error rates over time.
Easy to setup if you are using a logging framework such as Log4j or Logback.
None
APM providers, Raygun, Stackify
How GWB Found Hidden Exceptions and Application Performance Problems
When trying to improve an app’s performance, you often need not simulate requests from users, but to instead monitor its actual operation.
By monitoring JavaEE Servers in both production and QA environments, you become able to make decisions based on trends, before problems become too severe.
You could also find out the causes of response times, implementing optimizations based on such times.
JavaMelody is an example of a tool that can help you perform environment monitoring.
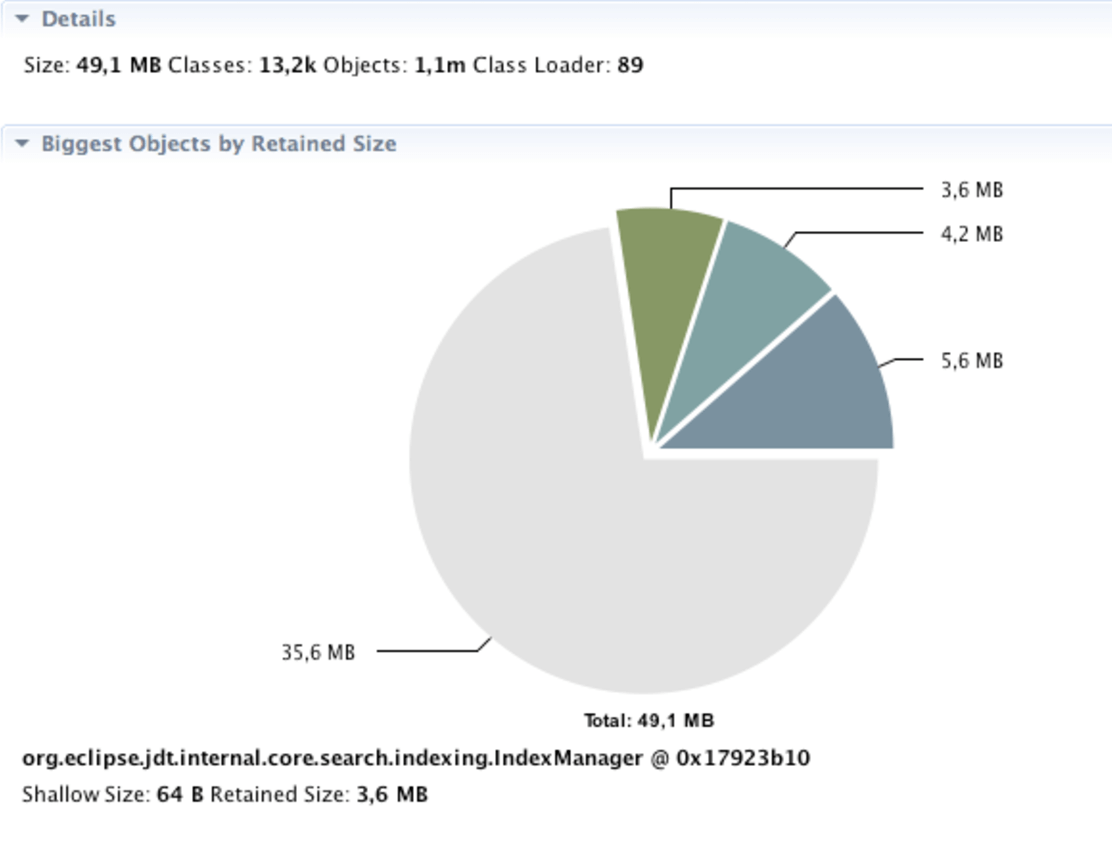
Application memory analysis after a crash can help with identifying the cause of a memory leak. You can instruct the JVM to dump the heap on an OutOfMemoryError exception by adding the following argument to the JVM:
-XX:+HeapDumpOnOutOfMemoryError
The heap dump file can be loaded into an analyzer: Eclipse MAT. You can dive into the Overview or Leaks Suspects reports to help identify the cause of the memory exception.
The big takeaway is that Java performance monitoring is easier than ever with all these tools.
Don’t be overwhelmed by all the things you should be doing. Start with the low hanging fruit first, like exception tracking.
It is really good to at least know what options are available to you, and I hope you found this list helpful.
Stackify's APM tools are used by thousands of .NET, Java, PHP, Node.js, Python, & Ruby developers all over the world.
Explore Retrace's product features to learn more.


