Debugging performance issues in production can be a pain and, in some cases, impossible without the right tools. Java profiling has been around forever, but the java profilers most developers think about are only one type: standard JVM profilers.
However, using one type of profiler is not enough.
Suppose you’re analyzing your application’s performance. There are multiple profiling activities which you may execute. Generally, standard profilers handle memory profiling, CPU profiling, and thread profiling.
But even with all this coverage, by using a combination of multiple profilers, you’ll find more performance issues. This is because each profiler is better in a certain aspect for chasing a performance bug.

In this post, we’ll discuss about the three types of Java profilers and why we need all of them while developing the application. We’ll start with the types and dive deep into each of them.
Let’s take a look into the three different kinds of Java profilers:
Products like VisualVM, JProfiler, YourKit and Java Mission Control.
A standard Java profiler certainly provides the most data, but not necessarily the most useful information. This depends on the type of debugging task.
JVM profilers will track all method calls and memory usage. This allows a developer to dive into the call structure at whatever angle they choose.
Pros:
Cons:
Products like XRebel and Stackify Prefix.
Lightweight profilers take a different approach at tracking your application by injecting themselves right into the code.
Aspect profilers are pretty easy to set up, but they are limited in what they can monitor and are encumbered by detailing out everything you want to be tracked. Java Agents have a big advantage in their tracking depth but are much more complicated to write.
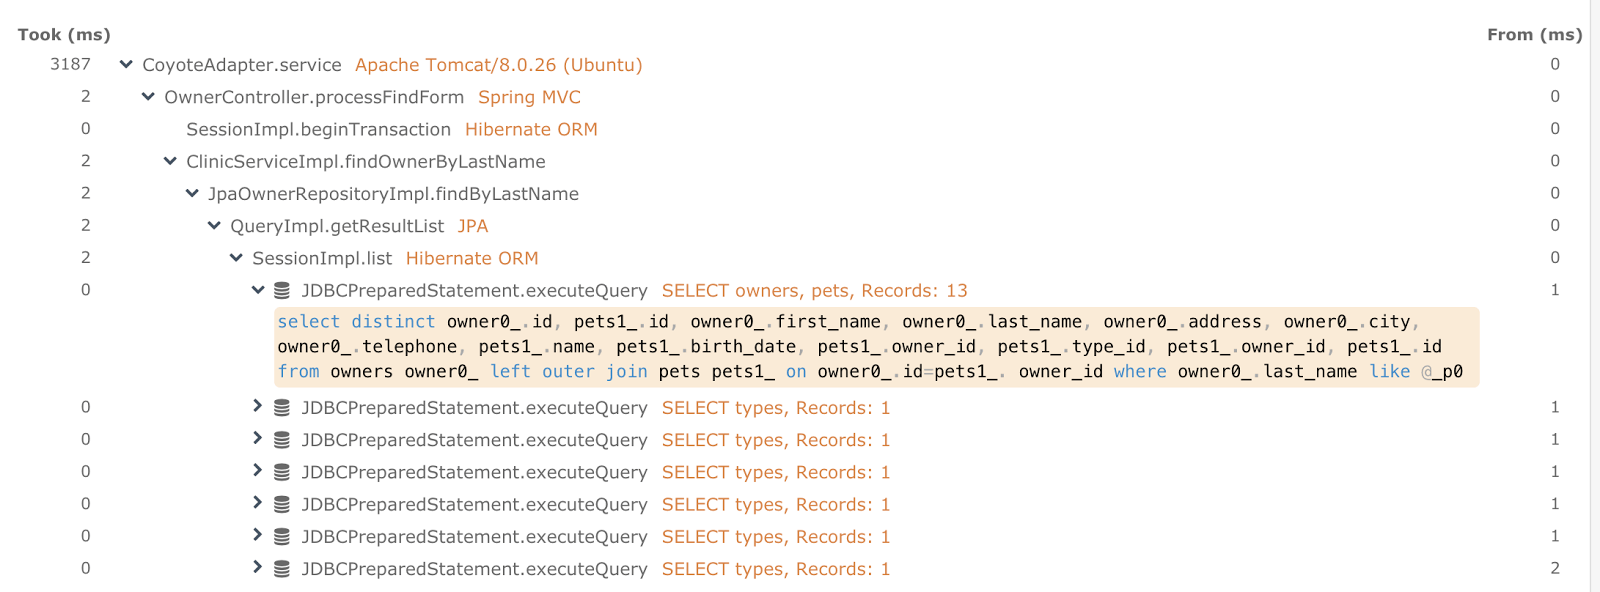
Stackify Prefix is a developer-oriented Java profiler using the Java Agent profiler method behind the scenes.
The cool thing is that Prefix already knows the most desired classes and 3rd party libraries developers want to be instrumented—so you don’t have to detail them all out. Plus, it takes all the stats from the instrumentation and displays them in simple and understandable manner.
As an example, when running an application using Hibernate, Prefix will not only detail out the elapsed time for queries but also displays parameter values for the generated SQL. When your app calls to a SOAP/REST API, Prefix provides the request and response content.

All the profilers so far have been great for development, but tracking how your system performs in production is critical.
Production is always a different landscape—development and staging setups typically don’t have the same datasets and load.
Java APM tools typically use the Java Agent profiler method but with different instrumentation rules to allow them to run without affecting performance in productions. The trick with these profilers is to provide the right information in a smart way to not take up CPU cycles.

Stackify’s Retrace is an APM tool that uses the same tech as Stackify Prefix with a few adjustments to run smoothly in staging and production environments.
This is done by aggregating timing statistics and sampling traces. This gives you method-level visibility to your application’s code that is running in production.
So when you have a slow web request, that will translate into a trace showing up in Retrace. From there you can dive in and see what methods are the culprit.

Retrace Screenshot: Web Request Aggregation over 4 hours
Standard profilers are good at finding performance issues in the development stage. But production is a different scenario. Your app’s behavior may change based on incoming traffic, server request, response, and many other things.

So, what is the solution to the production environment? APM tools are the answer. APM tools target the production environment and provide a report regarding your app’s performance.
So, standard profilers help in development and APM tools help in production. You may be wondering what the need is for lightweight transaction profilers.
Well, lightweight profilers follow a different approach to code profiling. They inject themselves directly in the code—especially at the start and end of a method.
They’re also easy to set up and consume relatively fewer resources. This is highly useful for applications that use hardware transaction memory. Those applications demand refined analysis tools that point out exactly which method or function is causing performance issues.
Undoubtedly, we can say that if you’re developing a complex application, you’ll need all three profilers. Each profiler type has a unique approach checking an application for performance issues.
RebelLab’s survey also showed that most companies use multiple code profilers for finding performance issues in their application.
XRebel is a cool tool, but it costs $365 a year. Stackify Prefix is free and provides much of the same functionality.
The biggest problem with APM solutions is definitely their pricing. They have traditionally been so expensive that only the largest enterprises could afford them.

It doesn’t make a lot of sense to spend approximately $100 a month on a server at Azure or AWS and then spend almost $200 a month for a product like New Relic.
Monitoring tools shouldn’t cost more than the servers!
Read more: APM Pricing Is Now Affordable for All Developers, and Why They Should Care
Now that you have learned about the three types of Java code profilers, it’s time to decide whether you really need all of them.
The answer lies in your application’s nature.
If it’s small like a local business or shop’s expense management system, profiling is very simple. A standard profiler will do the job.
If you are developing a web application like a courier facility’s tracking system, your application may be accessed by thousands of users. In that case, you will also need APM tools for the production environment.
Finally, if your application is for embedded systems, you will need all three of them.
Choose well, and have fun developing an application that delivers optimum performance.
Stackify's APM tools are used by thousands of .NET, Java, PHP, Node.js, Python, & Ruby developers all over the world.
Explore Retrace's product features to learn more.


