
As PHP applications are getting more complex, it’s becoming harder to deliver high-quality applications. It’s more important than ever to perfect your process for PHP performance monitoring.
Tools like Application Performance Monitoring (APM) are essential for the development process. To get good performance data, developers need to deal with the rising trends of containerization, microservices, heterogeneous cloud services, and big data.
To simplify this, and mitigate the amount of in-depth involvement and the time developers spend on PHP performance monitoring, products like Retrace come into play. Retrace provides a comprehensive PHP application monitoring solution that pinpoints the code in the application causing exceptions.
In this guide, we will cover the essential features of our Retrace PHP agent to identify and solve performance issues, so you can create applications that offer the best user experience.
The following topics will be addressed.
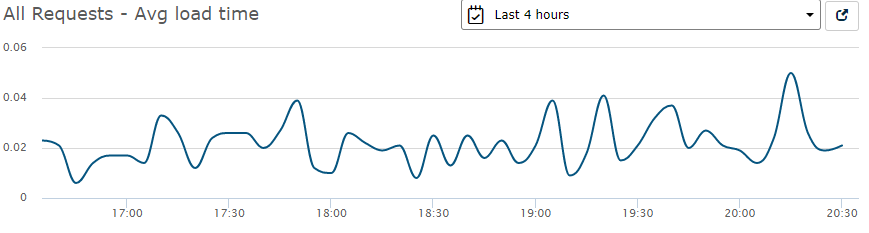
Performance monitoring has become critical for all business applications. A developer must know how their apps are performing to ensure the quality experience that today’s consumers expect. Critical issues found, such as slow page loads, will impact high-level goals like a customer’s satisfaction when you’re monitoring performance.
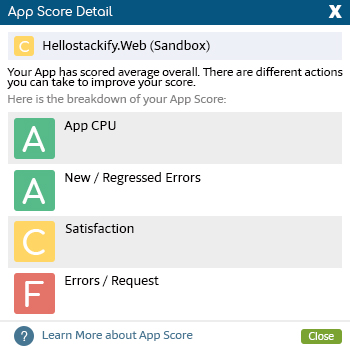
Because of the complexities of PHP performance monitoring, it is vital to have a tool like Retrace, a code-level APM solution, that can handle PHP application performance issues. It tracks the performance of your application using continuous monitoring and testing, giving you reports before you even suspect that there is something wrong.
Some key metrics you can track in a specific PHP application at a high level include:
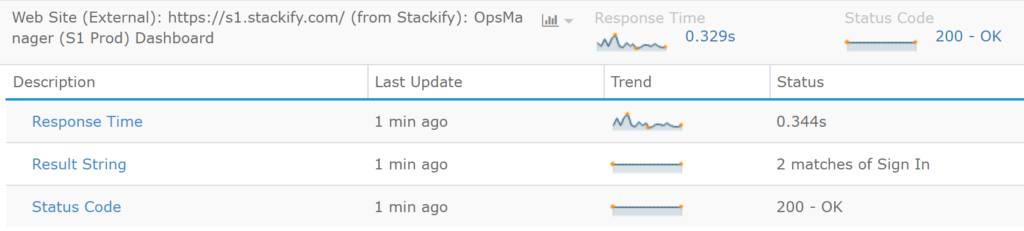
Retrace ensures that customers always get the experience they are expecting (and more) by monitoring the application. A simple HTTP check that executes every minute, or every few minutes, can provide crucial data to make sure your app is responding successfully (HTTP 200) and quickly. Monitoring also works well as the basis of Service Level Agreement (SLA) reporting.
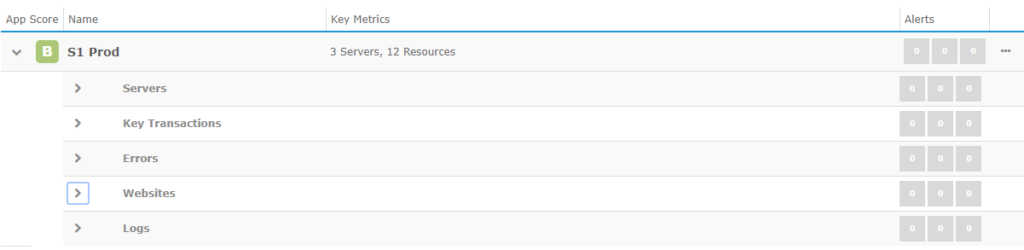
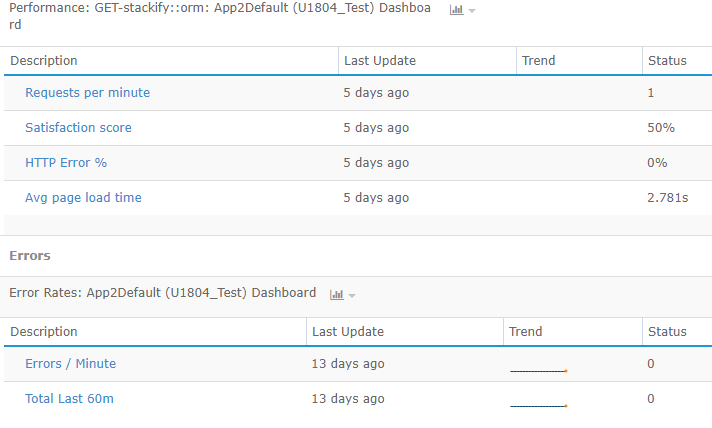
Every business has problems that arise where an application does not execute as expected. Rather than focusing on a long list of assumptions, the best thing to do is to identify specific web requests that are considered important and critical. These might include high-volume requests, problematic pages, or critical features such as a “shopping cart”. Retrace refers to these as “key transactions”, and it displays a dashboard for close monitoring of these critical functions and provides an overview of the total health status of your application.
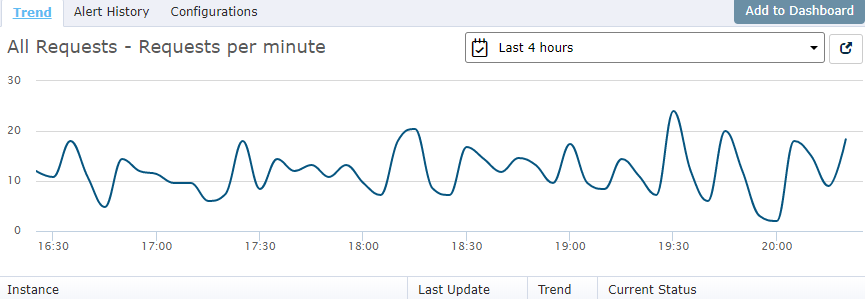
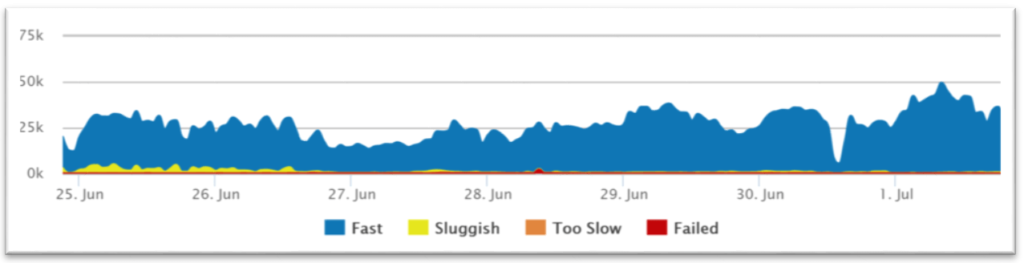
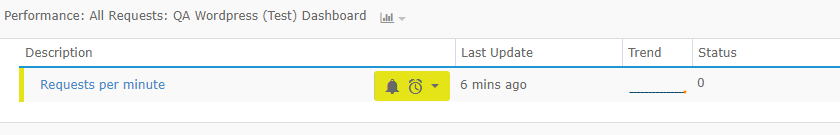
You can either “acknowledge all,” or “specify an alert,” by navigating into the Monitoring tab and clicking ‘Current Alerts’. For every web application, we consider traffic an application acceptance parameter. If the traffic drops, it indicates there might be a serious problem. As shown below, we have configured the “requests per minute” feature.
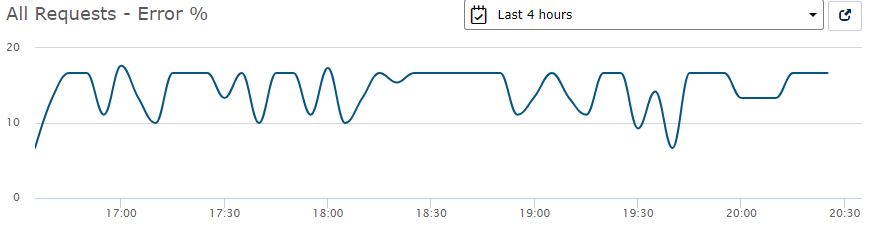
Application exceptions are the first thing that developers look at when they troubleshoot an application that is not working as expected. Whether the root cause is simple or complex, they should all be resolved to prevent performance problems.
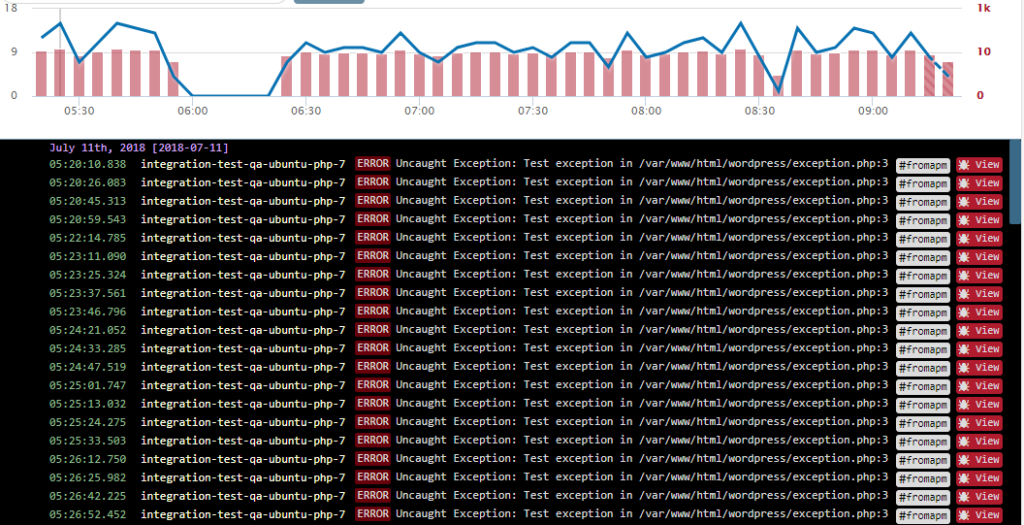
For this test app environment, QA WordPress (Test), we encountered a series of spikes as shown below:
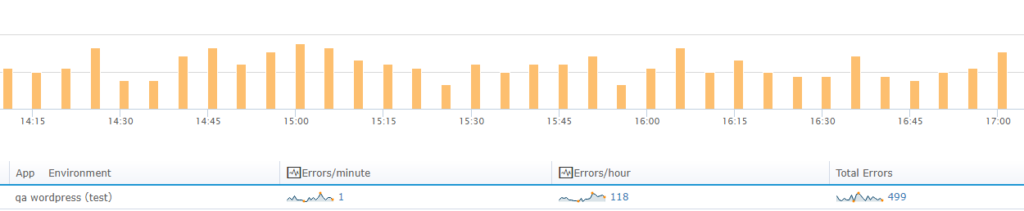
Retrace can provide the details of the exception that might help data-driven business decisions. Important information such as errors per minute, errors per hour and the total errors are stored and can be accessed by customers in real-time.
Retrace offers robust error tracking and monitoring that helps resolve issues. When it finds an error, or a sudden error burst occurs, it can send an email notification right away. We recommend that you monitor your error rates aside from configuring specific alerts.
For ease of use, Retrace offers de-duplication of errors. With the complexity of applications, each unique exception may occur several times. It summarizes the number of occurrences and detailed descriptions as shown below:

As mentioned above, different applications can have unique attributes, but one thing that most have in common is a huge reliance on centralized SQL databases. We must take database performance monitoring seriously to prevent performance degradation.
Retrace can help you with performance tuning in SQL Server.
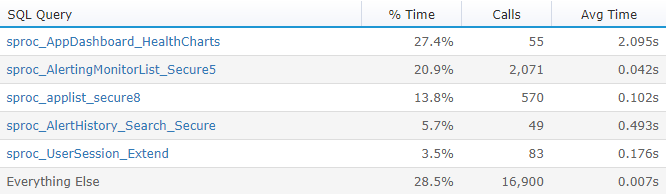
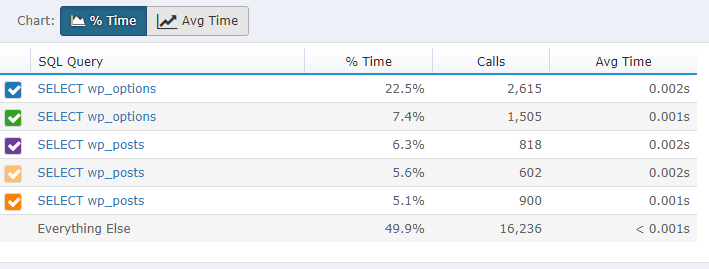
Many possible scenarios can cause major problems for a PHP application. Detailed SQL monitoring provides key functions such as number of calls, average time, and percentage of calls. As shown below, this feature can provide insight to figure out the problems associated with numerous calls that might be associated with caching logic.
PHP application performance highly depends on how the developer approaches solution architecture. For example, executing too many SQL queries can cause slow request times. As we all know, interacting with a database is a time-consuming process. Also, frequent querying will degrade performance of a PHP application.
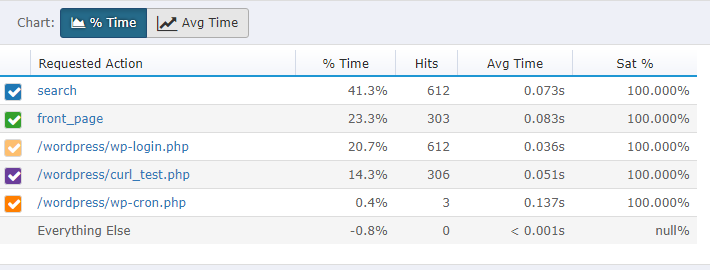
A new PHP application with a considerable database size and application structure is a perfect application to use with Retrace. As the application goes live, Retrace allows you to configure specific SQL queries. This is vital if there is a specific query that slows down and affects its performance.
Retrace enables customers to monitor critical queries used most of the time. Having an eye on a specific query critical to the overall performance of the application is a great way to maintain the application’s quality of service.
Besides SQL databases and queries, monitoring application dependencies in Retrace can help identify PHP application performance problems. With the dynamic and ever-changing trends in application development, dependencies include MongoDB, Redis, Elastic Search, and many others.
Most PHP cloud-based application monitoring is a service and since Retrace tracks the application at the code level, it can identify common dependencies. Check dependencies and supported technologies here.
The ever-changing demands in software development make today’s application rely on many dependencies. These present new ground to cover as it makes it easy to use an array of platform-as-a-service (PaaS) offerings.
Stackify uses Microsoft Azure or Amazon Web Services (AWS), and its products are the dependencies designed to support diverse services such as caching, storage and queueing. In Azure, for example, we use features such as Cloud Service, App Service, Azure Functions, Virtual Machines, and SQL Elastic Pools.
These dependencies introduce potential points of failure, which nobody wants, so it is important to have in-depth monitoring. Tracking performance of your application dependencies is critical to identify if the problems relate to your own code or an external dependency. This shows dependencies covering a simple PHP application.
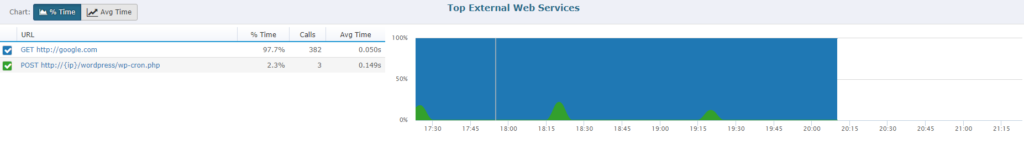
Many well-established organizations have developed applications that handle a huge number of web services every day. They serve external applications to integrate stock market updates, weather forecasts, and much more.
Although it is important to track application dependencies, HTTP web services must not be left out. Retrace helps you monitor web services with its more advanced customization features. However, a clearer definition of composition and detailed reporting per external web service is advised.
Monitoring log files is important for debugging. It is a versatile process for developers that helps troubleshoot production problems. Logs contain information that isn’t available anywhere else, and Retrace can mine that data for you to get you the most insight.
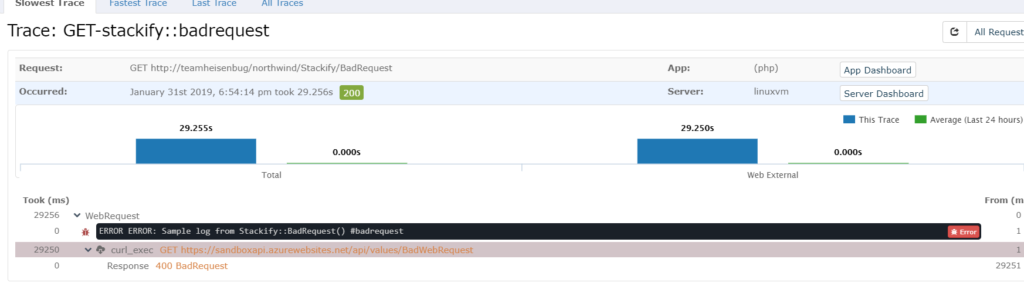
Instead of having to wade through log files to find the events leading up to the error, Retrace presents the relevant log statements that occurred just before the error. It will connect you to log statements that will help you solve the issue – no need to sift through thousands of log statements scattered across multiple log files and servers.
View and search all of your PHP logs across every environment, application, and server. This makes it easy to troubleshoot problems with your PHP applications.
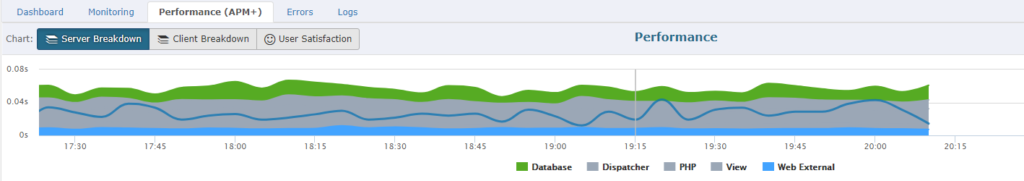
Troubleshooting application performance problems can be tedious. A detailed PHP request tracing down to the code level can identify issues. Retrace collects traces of all of your PHP requests – it is called Retrace because it lets you retrace what your code is doing.
More developers are getting familiar with application monitoring as it can reduce development time and speed delivery of high-quality applications. This guide introduced you to the basic elements of PHP performance monitoring. Keep in mind that application performance isn’t just about your code, but also ensuring that your application is performing as intended.
Stackify's APM tools are used by thousands of .NET, Java, PHP, Node.js, Python, & Ruby developers all over the world.
Explore Retrace's product features to learn more.


