Are you looking to get up and running with Winston logger in Node.js? Do you want to understand best practices (and pitfalls) for structuring application logging in Node.js?
If that’s what you’re looking for, you’re in the right place!
For me, logging was always a somewhat mystical and frustrating idea. I could grasp the concept that you wanted to output information about your system… but the details on what to log and how to log eluded me.
The problem was when I turned to the internet for answers, I could only find tutorials that would show me how to log to a file. These articles rarely explained the full picture: What do you log? When do you log? How much do you log? Where do you put logs? What format should you log? Am I doing this whole logging thing right?
I did not understand. I still had so many questions. And I guess you must too, or you wouldn’t be here! Well, you’re in luck—these questions are exactly what we will answer today.
Today, we will be looking at Winston, the most popular logging library in Node.js, and why it’s so popular. We’ll dive into the ins and outs of why to use logging and how and what to log in a practical way. And after that, we’ll round off with some best practices for structuring your Node.js application so you can write easy, elegant, and clean logging code, using the Express framework.
Sound good to you? Let’s get to it.
The first, most important question is, “Why bother logging at all?”
Let me put it simply. Logs are a simple way of persisting data about your application so you can view this data for analysis later. A great use case for logging would be if, for example, you have a bug in your system and you want to understand the steps that led up to its occurrence.
When you’re working on smaller systems, this can seem like overkill, especially if your application isn’t that big. But as an application grows in size—or possibly multiplies into many smaller systems, perhaps by using microservices or functions—logging becomes even more important because of the increased complexity.
At that point, you will definitely want to have logging tools in place. Preferably, a tool that can integrate errors and logs so you have all the context you need. Tools like Retrace can give you those insights and much more.
Today we’re talking about logging within the context of Winston.
If you’ve written JavaScript before, you’ll be used to console.log, the built-in method of logging output. For Winston, the first question you might have is, “What’s wrong with console.log?”
Nothing is wrong with console.log, per se. But Winston gives us more powerful features than the humble console log, such as
That’s just a few reasons you’d want to use Winston over the humble console.log.
We’ve talked a lot about the abstract concepts surrounding Winston. So let’s introduce it and look at the syntax.
Let’s quickly set up a basic logging example using Winston.
Don’t worry, it’s not too much. And we’ll be building on top of this basic example as we go.
If you want to follow along, start by installing Winston via npm.
npm install winston --save
Then create the following logging code and save it into a file (of any name).
const winston = require('winston');
const logger = winston.createLogger({
    transports: [
        new winston.transports.Console()
    ]
});

logger.info('What rolls down stairs');
logger.info('alone or in pairs,');
logger.info('and over your neighbors dog?');
logger.warn('Whats great for a snack,');
logger.info('And fits on your back?');
logger.error('Its log, log, log');
Then all you need to do is run the file with:
node yourFileName.js
And voila!
{"message":"What rolls down stairs","level":"info"}
{"message":"alone or in pairs,","level":"info"}
{"message":"and over your neighbors dog?","level":"info"}
{"message":"Whats great for a snack,","level":"warn"}
{"message":"And fits on your back?","level":"info"}
{"message":"Its log, log, log","level":"error"}
Okay, so while this is a simple example, it raises a few questions. What does createLogger do? And why is the output formatted like that?
Let’s look at the createLogger method first. The createLogger method is one that takes a config object and returns a logger object with several methods bound to it which are your logging levels (more on this later). That means we can use this object and the logging levels, for instance, to create our example log output.
As you can see, Winston is using JSON by default. It’s also putting our message into a property (of the same name) and adding a level property. This is what we want: structured log data. Again, more on this later.
So there you have it! A simple Winston installation.
But wait—there’s more!
I couldn’t leave you hanging like that, as I know you’ll have other questions, like, “Why JSON?” “What are the best practices for logging?” “How do I structure my log code using Winston?”
Let’s talk about those things next.
The answer to what you should log has a short answer and a long answer.
Let’s start with the short answer:
Okay, that’s simplistic. What do I mean?
With logging, it makes sense to log as much data as you can. The richer and more structured your log data, the better you’ll be able to visualize and act on that log data.
Learn more about structured logging and why developers need it.
But despite this, there are no “right” things to log. What’s important for you to log really depends on your situation.
But to give you a few good starting points, log data such as
You get the idea.
I should note that while you should log as much as you can, there’s an exception. You don’t want to log any sensitive data, such as passwords, secret keys, or personal data. Remember, logs are data still, so they’re still governed by the same rules and laws as any other data. So be careful what you’re logging.
Okay, I’ve told you to log lots of rich data—the kind that tells you a lot about your application—which leads us nicely onto the next part.
How should we log? In what format, and why?
With logging, the format you pass is important. If there’s one big thing you should take away from this article, it’s this:
By nature, machines are far better at deciphering large amounts of data. And if you’re doing even a moderate amount of logging in a small application, you’ll be drowning in logs.
JSON is the default standard for logging in Node.js and is a great option with Winston. Most logging tools also support JSON out of the box, so many will also parse your JSON logs when they’re put into your APM. This is great as it allows you to do things like visualizing based on properties (and even nested properties).
For the curious, we should note that you can log in any format you want—strings, delimited, or a custom format. However, custom format should be avoided where possible. A lot of logging tools will let you parse custom formats. You must specify the rules for every different format, and this can be time-consuming and costly.

So now you’ve got your head around why you’d want to log in the first place, what format you want to be logging in, and how to get up and running. Next, we need to ask another question: how should you structure your log code?
In structuring log code, you want to be logging consistently. Below are techniques in Node.js to help keep your log structures consistent.
One pattern I like is passing log namespaces. Messages are useful for humans who want to understand the error, but they can be hard to search in a log aggregation tool.
With namespaces, you can also create your own namespace dictionary, which allows you to define which namespace patterns you want and reject any calls to logs that don’t conform to your namespace dictionary patterns. That makes it much easier to enforce clean logging standards throughout your application.
A logging namespace implementation could look as simple as this:
logger.info('server.endpoint.get.users.getusersfromdb.format');Here, you’d build up the hierarchy of your application so you can easily see the point where an error occurred. The above example shows us that the log originated in our server, in a GET endpoint called “/users” while it was formatting a response retrieved from the database. Namespaces just make it easier to recognize and locate your logging from within your application.
The facade pattern is a design pattern that hides more complicated implementation details. Why do I mention the facade pattern? Because you can leverage it to write more elegant logging code that’s put in place.
I know things like design patterns can seem abstract. So to help those who need a concrete example, let’s introduce one. To try to keep it realistic, we’re going to introduce Express, a common framework in Node.js for creating web servers.
If you want to, try out the following example:
npm install express --save
And add the code to the bottom of your existing logger file.
const express = require(‘express’);
const app = express();
const port = 3000;

const handler = (func) => (req, res) => {
    try {
        logger.info('server.handler.begun');
        func(req, res, logger);
    } catch(e){
        logger.info('server.handler.failed');
        res.send('Oh no, something did not go well!');
    }
};

app.get('/success', handler((req, res) => { res.send('Yay!'); }))
app.get('/error', handler((req, res) => { throw new Error('Doh!'); }))
app.listen(port, () => console.log(`Example app listening on port ${port}!`))
As you can see, the above code is wrapping your regular Express handler with additional functionality. Open a browser window and enter these URLs to illustrate your log outlet.
http://localhost:3000/success
http://localhost:3000/error
http://localhost:3000
This allows you to log your application code in a way that’s consistent across your application. Here, we’re using functional programming in Node.js by passing the handler function as a callback to our handler function, allowing us to execute the function within the context of a try/catch. All of this means we can apply error handling in a way that makes sense.
Building on top of the previous example of the Express handler, we can leverage Express middleware to implement logging between the functionalities of our application.
Express middleware is a way of augmenting Express regular handlers with additional functionality that’s intercepted. Middleware intercepts requests for purposes such as authentication—or in our case, logging!
Middleware is useful. Because it can be passed as a function to an existing endpoint, it’s very flexible and can be called on all endpoint accesses. Or middleware can be composed in arrays to create collections of middleware to apply. For logging, this can make life a lot easier. Having a simple access logging middleware is definitely a great starting point if you’re using Express. There is additional Express logging middleware, Morgan and/or Bunyan, that may be used, even along with Winston.
Try adding the following above your previous Express handlers:
app.use( (req, res, done) => {
    logger.info(req.originalUrl);
    done();
});
Now your application has some nicely abstracted logs using the facade pattern, and a nice intercepting middleware that will log server access to your Express application: Nice! Now try those URLs again to see the logging output now after the change.
If a log is logged, but no alert is triggered or it’s visualized, was it logged at all?
— philosophical Node.js developer (contrived)
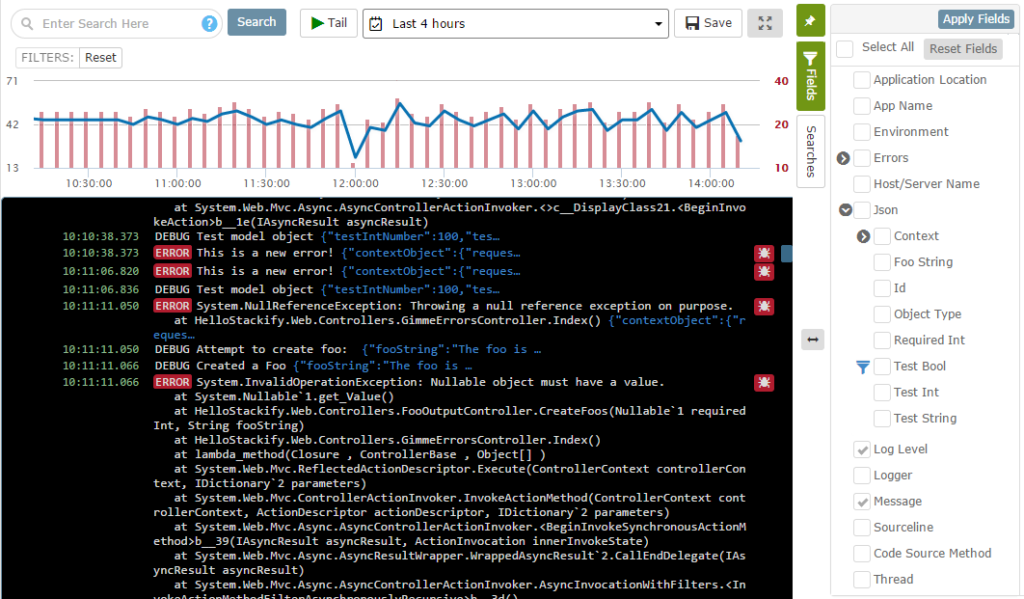
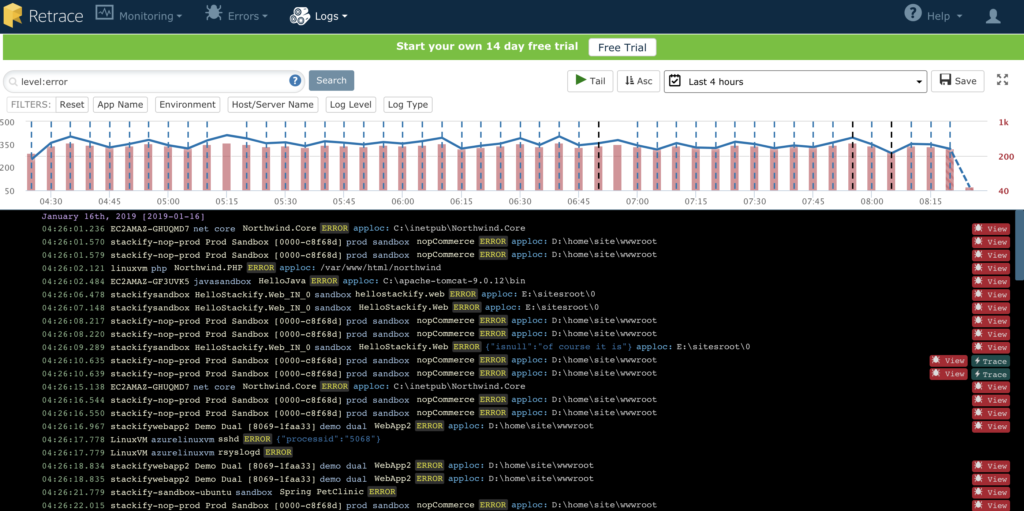
The real value of structured logs is when you run it through a centralized logging platform like Retrace. Retrace allows you to view all logging messages in an inline view across all apps, servers, and in all environments. It can give you more contextual insights to help you troubleshoot issues.
You can easily pinpoint errors by applying filters and fields to weed out unneeded information. You can isolate the logs you are looking for by specifying the environment, server, or application. You also can search for terms in your log messages.
Retrace supports both the Winston logging framework and logging directly to the Stackify API. A simple configuration change is all that is needed. See our documentation on how to configure Node.js logging.
Hopefully, that was a useful introduction to Winston and some best practices in Node.js for how to structure your code to keep it clean and consistent with the facade pattern and logging namespaces.
You become better at logging with practice. Write to your log files and try to access them later, with a tool such as Retrace to debug and understand your system—you’ll soon become familiar with what’s useful and what’s not.
Just remember…
Stackify's APM tools are used by thousands of .NET, Java, PHP, Node.js, Python, & Ruby developers all over the world.
Explore Retrace's product features to learn more.


