Troubleshooting a problem on a remote server, especially in production, is not an easy task. Sometimes it involves debugging the application code directly on the server.
But the production servers are usually run in a strict environment, where not all convenient developer tools are available.
In this article, you’ll discover how to configure a running web server and debug your application using standard facilities provided by the Java platform.
First off, if you try to connect to a remote running Java server which you did not specifically configure for debugging, you’d most likely fail. This means that the configuration steps should be taken in advance.
On the other hand, you wouldn’t want to always keep the production server running with debugging configuration enabled, as it could affect the performance, and definitely weaken security.
The debugging mode slows down the server since it disables some JVM optimizations that otherwise provide the significant performance boost.
Also, the debugging mode can be a potential security risk. You need to provide the debugger with the access to the server via a specific port which would be another potential security hole for bad actors.
Java Platform Debugging Architecture (JPDA) is an extensible set of APIs, part of which is a special debugging protocol called JDWP (Java Debug Wire Protocol).
JDWP is a protocol for communication between the application and the debugger processes, which can be used to troubleshoot a running Java application remotely.
To configure the remote application for debugging, you have to enable the debug mode and specify the parameters for this protocol.
To run a regular serverless Java class Test with debugging enabled in the Oracle HotSpot JVM, you need to use the following command:
java -Xdebug -Xrunjdwp:transport=dt_socket,address=8000,server=y,suspend=y Test
As you can see, you basically need only two JVM options: -Xdebug and -Xrunjdwp. Note that these are X-arguments, which means that they are not standardized and may not work as expected in other JVM implementations.
The -Xdebug argument enables the debugging itself, and the -Xrunjdwp argument configures the JDWP protocol with several important parameters.
The transport parameter of the -Xrunjdwp argument defines the means of interaction between the application and the debugger. It has two values available out-of-the-box: dt_socket (using a socket interface) and dt_shmem (using shared memory).
The dt_shmem value means that the debugger and the application will interact via a shared memory region. Thus, it can only be used when running the debugger and the application on the same machine.
Since you’re intending to debug a remote server, this won’t help you much, so the shared memory mode won’t be discussed here.
And, thanks to the extensibility of JPDA, you can also write your own transport implementation, if these two do not suit your needs.
Another abstraction of JPDA is the connector. The connector defines exactly how the debugger connects to the remote virtual machine. As you can imagine, connectors depend on the transport you choose, but they offer many other interesting features.
For example, usually, you’d want to connect to an existing process that waits for the debugger. But sometimes it could be useful to invert the client-server relation.
You can configure a connector to keep the debugger running as a server and wait for the connection from the debugged machine, which would in this case act as a client.
Other connectors allow you to “connect” to a core dump of a crashed application or launch the debugged VM from the command line. Again, you can write your own connector for any special case. But we won’t discuss these advanced scenarios here.
In this simple example, you just use a Socket Attaching Connector, which is enabled by default when the dt_socket transport is configured and the VM is running in the server debugging mode.
The server parameter of the -Xrunjdwp argument specifies that this VM will act as a server for the debugging, and the debugger itself would have to connect to it as a client.
The suspend parameter of the -Xrunjdwp argument specifies whether you want to suspend the debugged JVM until the debugger attaches to it.
By default, the suspend parameter has the value “y“, which means that the virtual machine would be suspended before it had the opportunity to load the main class, and the attached debugger would resume the execution of the VM.
Since you usually need the web server to boot properly before you can debug your application, you should set the suspend parameter to “n“. However, if you need to debug some initialization code of the application, then you should keep the value of this parameter to “y“.
You also have to specify the address parameter to set the TCP port on which your debugged application would be listening for a debugger. Once a debugger attaches to this port, debugging starts. In your case, this port is 8000, but you can set it to any other value you like.
To check out how remote debugging works, you can use the Apache Tomcat 8 web server. Any other web or enterprise Java server can be set up for debugging with the same parameters, although they may be configured in different ways.
For Tomcat, the catalina script already contains all the default debugging configuration values that were discussed in the previous chapter, as described in the Tomcat wiki. To enable them, run the script with the jpda argument:
catalina jpda start
The specific parameters of the JDWP protocol are controlled with the following environment variables:
To demonstrate the debugging, you’ll create a simple Spring Boot application with a REST endpoint. You’ll need to specify packaging as a war file to be able to deploy it to the server. Also, the spring-boot-starter-tomcat dependency should be specified with the provided scope:
<packaging>war</packaging>

<dependencies>

    <dependency>
        <groupId>org.springframework.boot</groupId>
        <artifactId>spring-boot-starter-web</artifactId>
    </dependency>

    <dependency>
        <groupId>org.springframework.boot</groupId>
        <artifactId>spring-boot-starter-tomcat</artifactId>
        <scope>provided</scope>
    </dependency>

</dependencies>
Let’s also specify the name of the resulting war file and a Maven plugin to build it:
<build>
    <finalName>remote-debugging</finalName>
    <plugins>
        <plugin>
            <groupId>org.springframework.boot</groupId>
            <artifactId>spring-boot-maven-plugin</artifactId>
        </plugin>
    </plugins>
</build>
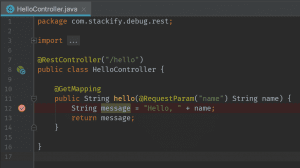
A simple hello world controller will provide a web service endpoint – with a single parameter:
import org.springframework.web.bind.annotation.*;

@RestController("/hello")
public class HelloController {

    @GetMapping
    public String hello(@RequestParam("name") String name) {
        String message = "Hello, " + name;
        return message;
    }
}
Here’s how you build the application:
mvn clean package
And then simply copy the resulting file target/remote-debugging.war to the tomcat/webapps directory. When deployed to your server as a war file, this application can be accessed by the following URL: http://localhost:8080/remote-debugging/hello?name=John
If all went well, you now have a debuggable server with the deployed, running web service.
Popular Java IDEs also have very convenient debugging facilities. But sometimes you don’t have an IDE readily available, especially if you need to debug a production server which is not usually directly accessible from the development environment.
In this case, a simple but powerful console utility can save the day.
Let’s attach the standard Java debugging utility jdb to the running process of the server:
$ jdb -attach localhost:8000 -sourcepath ~/dev/remote/src/main/java/
Set uncaught java.lang.Throwable
Set deferred uncaught java.lang.Throwable
Initializing jdb ...
>
The utility is attached and ready to receive your commands.
The sourcepath argument allows you to provide the colon-separated list of paths to look for the sources. You can provide not only the sources of your application but also the sources of the libraries you use, to be able to easily follow their source code during the debugging session.
In this example, you run the application locally. But since you’re using sockets as the transport for the debugging, instead of localhost, you could specify any other host, and nothing particular would change.
Now let’s put a breakpoint at the start of your HelloController.hello() method:
> stop in com.stackify.debug.rest.HelloController.hello(java.lang.String)
Set breakpoint com.stackify.debug.rest.HelloController.hello(java.lang.String)
Note that you have to specify both the fully qualified name of the class and fully qualified names of the arguments of the method.
You could also see the following error instead of the successful “set breakpoint” message:
> stop in some.non.existing.Class.method()
Deferring breakpoint some.non.existing.Class.method().
It will be set after the class is loaded.
Basically what jdb says here is that it does not know anything about the provided class, because some of the application classes may be lazily loaded later on demand. But in most cases, this probably means that you’ve misspelled the name of the class.
If you’ve successfully set the breakpoint, then you can go to the browser and hit the service once again:
http://localhost:8080/remote-debugging/hello?name=John
The page load will stall. Switch to the jdb console, and you’ll see something like:
Breakpoint hit: "thread=http-nio-8080-exec-10", \
  com.stackify.debug.rest.HelloController.hello(), line=12 bci=0
12                  String message = "Hello, " + name;
http-nio-8080-exec-10[1]
First of all, you see that the breakpoint occurred in the http-nio-8080-exec-10 thread. This is one of the threads from the pool used by Tomcat to handle the incoming HTTP requests on the 8080 port. You also see that there’s probably at least 10 of these threads.
Then you can see the name of the class, the method name and the line number where the debugger has stopped the program.
The bci, or the bytecode index, specifies the number of the bytecode instruction you’re currently at. This may be important because every line of code in the Java source usually corresponds to multiple bytecode instructions.
Finally, thanks to the attached sources, you can see the contents of the source code line on which the break occurred.
To check out the code around the current line, you can make use of the list command:
http-nio-8080-exec-10[1] list
8    public class HelloController {
9
10        @GetMapping
11        public String hello(@RequestParam("name") String name) {
12 =>         String message = "Hello, " + name;
13            return message;
14        }
15
16    }
Now you can see the code of the controller and the exact place you’re at, denoted by the arrow.
To check out all methods in a class, you can use the corresponding command. Note that <init>() represents the constructor, for which you can also set the breakpoint:
http-nio-8080-exec-10[1] methods com.stackify.debug.rest.HelloController
** methods list **
com.stackify.debug.rest.HelloController <init>()
com.stackify.debug.rest.HelloController hello(java.lang.String)
java.lang.Object registerNatives()
java.lang.Object <init>()
...
The classes command lets you explore the available loaded classes, but the number of them in a Spring-based web application would be pretty large and not very easy to navigate.
Let’s check out what is accessible to us at this point. You can easily see all local variables and method arguments in the current scope with the locals command:
http-nio-8080-exec-10[1] locals
Method arguments:
name = "john"
Local variables:
You’re in the hello() method, so the name argument is in the scope. Let’s see what’s inside:
http-nio-8080-exec-10[1] print name
name = "John"
The print command is pretty useful, as it is the evaluation tool that has been around long before the jshell utility appeared in Java 9. The print command can be used to output anything that is accessible in the current scope.
The print can also evaluate some Java expressions; for instance:
http-nio-8080-exec-10[1] print name.length()
name.length() = 4

http-nio-8080-exec-10[1] print 1 + 2 + java.lang.Math.sqrt(3)
1 + 2 + java.lang.Math.sqrt(3) = 4.732050807568877
The where command shows the current stack trace and allows you to see where you’re at:
http-nio-8080-exec-10[1] where
[1] com.stackify.debug.rest.HelloController.hello (HelloController.java:12)
[2] jdk.internal.reflect.NativeMethodAccessorImpl.invoke0 (native method)
[3] jdk.internal.reflect.NativeMethodAccessorImpl.invoke \
  (NativeMethodAccessorImpl.java:62)
[4] jdk.internal.reflect.DelegatingMethodAccessorImpl.invoke \
  (DelegatingMethodAccessorImpl.java:43)
...
Currently, you’re at line 12 in the original file, which is the following:
String message = "Hello, " + name;
To step to the next instruction, you can use the step command:
http-nio-8080-exec-10[1] step
>
Step completed: "thread=http-nio-8080-exec-13", \
  com.stackify.debug.rest.HelloController.hello(), line=13 bci=20
13            return message;

http-nio-8080-exec-10[1]
Now the message variable is defined, and you can inspect it:
http-nio-8080-exec-10[1] print message
message = "Hello, John"
You can also use the step up command to run the code to the end of the current method, exit it and stop at the next line of the calling method:
http-nio-8080-exec-10[1] step up
>
Step completed: "thread=http-nio-8080-exec-1", \
  jdk.internal.reflect.NativeMethodAccessorImpl.invoke(), line=62 bci=103

http-nio-8080-exec-10[1]
Now let’s change the message variable with the set command:
http-nio-8080-exec-10[1] set message = "Goodbye, John"
message = "Goodbye, John" = "Goodbye, John"
http-nio-8080-exec-10[1]
To continue execution, use the cont or the run command:
http-nio-8080-exec-10[1] cont
>
After that, the page in the browser will be loaded successfully, but the message will be different.
Let’s remove the breakpoint. To see the list of available breakpoints, let’s enter the clear command:
> clear
Breakpoints set:
breakpoint com.stackify.debug.rest.HelloController.hello(java.lang.String)
Now call it to clear the breakpoint:
> clear com.stackify.debug.rest.HelloController.hello(java.lang.String)
Removed: breakpoint com.stackify.debug.rest.HelloController.hello(java.lang.String)
The jdb utility is definitely very powerful, but if you have the option, debugging in your favorite IDE is clearly easier.
The debug configuration is pretty easy to set up in any Java IDE. Here’s how it’s done in IntelliJ IDEA.
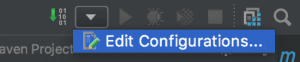
First, choose Run -> Edit Configurations… in the main menu or select the run configurations drop-down in the top panel:
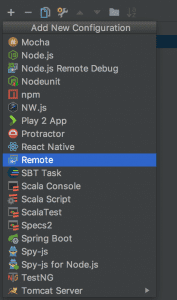
Click on the “+” button in the top-left corner of the configuration window and select the Remote configuration template:
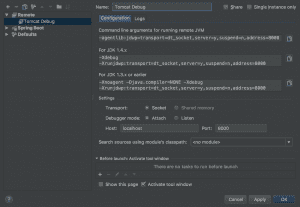
The default configuration is mostly good, you just have to provide a meaningful name and change the port to 8000, as in the example:
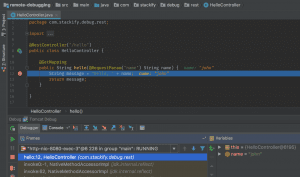
Now start the created debug configuration and put a breakpoint on a line of code. You should see a tick inside the red bubble, which means that the debugger is attached and ready to intercept:
Now open the page in the web browser, and the debugger should stop at the breakpoint. You’ll immediately see the stack trace and the values in scope:
In this article, you’ve discovered how to configure a Java server for remote debugging, and how to use a simple console tool to debug your application.
The source code for the article is available over on GitHub.
Stackify's APM tools are used by thousands of .NET, Java, PHP, Node.js, Python, & Ruby developers all over the world.
Explore Retrace's product features to learn more.


