Node.js Performance Testing and Tuning
By: Lou
| January 11, 2019

We know Node.js for its lightning-fast performance. Yet, as with any language, you can write Node.js code that performs worse for your users than you’d like. To combat this, we need adequate performance testing. Today, we will cover just that with an in-depth look at how to set up and run a performance test and analyze the results so you can make lightning-fast Node.js applications.
The best way to understand how to performance test your application is to walk through an example.
You can use Node.js for many purposes: writing scripts for running tasks, running a web server, or serving static files, such as a website. Today, we’ll walk through the steps to test a Node.js HTTP web API. But if you’re building something else in Node, don’t worry—a lot of the principles will be similar.
The unique nature of Node.js performance
Before we begin, let’s take a quick look at one of the more unique characteristics of Node.js performance. We’ll need to have knowledge of these characteristics later when we run our performance tests.
What am I talking about?
The big consideration for Node.js applications is their single-threaded, run-to-completion behavior—facilitated by what’s known as the event loop. Now, I know what you’re thinking: that’s a lot. So let’s break this down a little so we understand what these mean.
Let’s start with single threading. Threading, as a concept, allows concurrent processing within an application. Node.js doesn’t have this capability, at least not in the traditional sense. Instead, to write applications that perform multiple tasks at once, we have the asynchronous code and the event loop.
The event loop
What is the event loop?
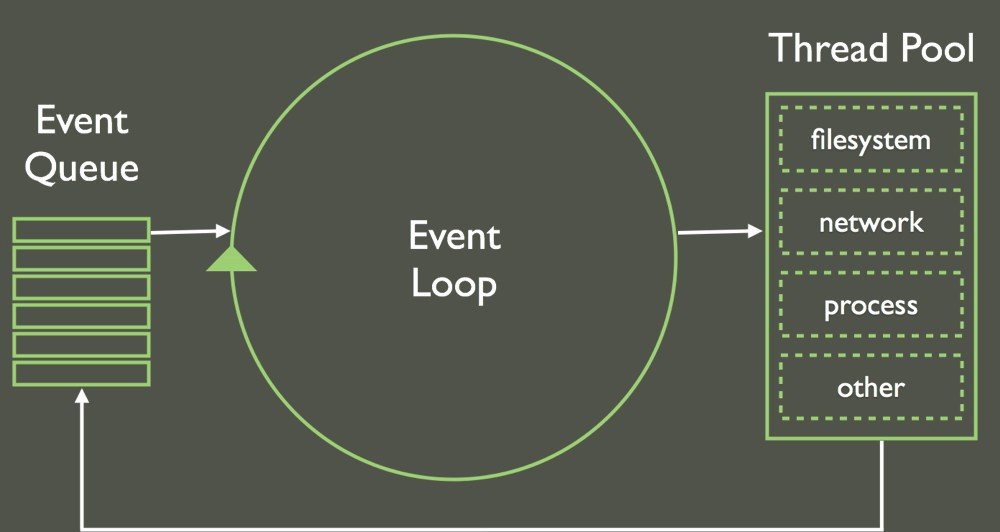
The event loop is Node.js’s way of breaking down long-running processes into small chunks. It works like a heartbeat: Every few milliseconds, Node.js will check a work queue to start new tasks. If there is work, it’ll bring these onto the call stack and then run them to completion (we’ll talk about run-to-completion soon).

By breaking tasks down, Node.js can multi-task, which is your substitute for threading. That means that while one task is waiting, another can start. So, rather than threading, we use async code, facilitated by programming styles like callbacks, promises, and async/await. Most of the out-of-the-box Node APIs have both a synchronous and asynchronous method of execution.
Okay, so maybe you’re wondering: what does all this techno-jargon have to do with performance?
Let me explain…
Node.js performance and the event loop
Imagine you’re building a Node.js application with two endpoints: one for file uploading, and one that fetches a user profile. The user profile API will probably be requested significantly more often than the file upload, and if it doesn’t respond quick enough, it’ll block every page load for every user—not good.
The user upload API is used infrequently. Also, users expect uploading of tasks to take time, but they’re a lot less forgiving with page load times. If we do not program with the event loop in mind, while the file is uploading, Node.js could end up hogging all the system resources and could block other users from using your application—uh-oh!
And that’s why you need to understand Node.js’s single-threaded nature. As we change our application, we need to consider this behavior. We want to avoid doing long-running tasks synchronously, such as making network requests, writing files, or performing a heavy computation.
Now we know about Node.js’s single-threaded nature, we can use it to our advantage. Let’s go step by step how you can set up, run, and analyze a performance test of your Node.js application to make sure you’re doing your best to leverage Node.js performance capabilities.
Step 1: Choosing Node.js performance test tooling
First, you’ll want to choose a tool that will allow you to run your performance tests. There are many tools out there, all with different pros and cons for Node.js performance tuning. One main thing to consider is that even though you’re testing a Node.js application if you’re going to performance test from the outside world across a network, it doesn’t matter if your performance test tooling is written in Node.js.
For basic HTTP performance testing, I like Artillery a straightforward performance testing tool written in Node.js. It’s also particularly good at running performance tests for API requests. Artillery works by writing a configuration file that defines your load profile. You tell Artillery which endpoints you want to request, at what rate, for what duration, etc.
A basic test script looks like this:
config:
  target: 'https://artillery.io'
  phases:
  - duration: 60
  arrivalRate: 20
  defaults:
    headers:
      x-my-service-auth: '987401838271002188298567'
scenarios:
- flow:
- get:
url: "/docs"
Here, you’re requesting Artillery’s website for a 60-second duration with 20 new users arriving at the URL.
Then, to run the test, you simply execute:
artillery run your_config.yml
Artillery will make as many requests to your application as you instructed it to. This is useful for building performance test profiles that mimic your production environment. What do I mean by performance test profile? Let’s cover that now.
Step 2: Create a Node.js performance test profile
A performance test profile, as above, is a definition of how your performance test will run. You’ll want to mimic how your production traffic does or is expected to, behave, if possible to do accurate Node.js performance tuning. For instance, if you’re building an event website, you’d expect lots of traffic around the time you release tickets, so you’d want to build a profile that mimics this behavior. You’d want to test your application’s ability to scale with large amounts of a load in a short amount of time. Alternatively, if you’re running an e-commerce site, you might expect even traffic. Here, your performance test profiles should reflect this behavior.
Leveraging multiple test profiles
A fun and interesting point to note is that you can create different test profiles and run them in an overlapping fashion. For instance, you could create a profile that mimics your base level of traffic—say, 100 requests per minute—and then mimic what could happen if you saw a lot of traffic to your site, say if you put out some search engine adverts. Testing multiple scenarios is important for thorough Node.js performance tuning.
Replicating large-scale distributed systems
I must take a second here to note something: When an application reaches a certain size, mimicking load in this fashion loses feasibility. The traffic volumes you may have could be so wild, unpredictable, or large in volume it’s hard to create a realistic like-for-like way of testing your application before release.
But what if this is the case? What do we do? We test in production.
You might think, “Woah, hold up! Aren’t we supposed to test before release?”
You can, but when a system gets to a certain size, it might make sense to leverage different performance test strategies. You can leverage concepts like canary releasing to put out your changes into production and test them only with a certain percentage of users. If you see a performance decrease, you can swap that traffic back to your previous implementation. This process really encourages experimentation, and the best part is that you’re testing on your real production application, so no worries about test results not mimicking production.
So far we’ve decided on our tooling, and we’ve created profiles that recreate our production, like traffic and workloads. What do we do next? We need to ensure that we’ve got the data we need to analyze our application, and we do that through Node.js performance monitoring and Application Performance Management (APM) tools. What’s an APM? Read on, and I’ll let you know!
Step 3: Set up your observability/monitoring
We don’t want to just run our performance test against our application and hope and pray. If we do, we won’t be able to understand how it’s performing and whether it’s doing what we think it should. So before we begin, we should ask ourselves questions like “For my application, what does good look like? What are my SLAs and KPIs? What metrics are needed to effectively debug a performance issue?”
If your app performs slowly, or different from what you expected, you’ll need data to understand why so you can improve it. All production applications worth their salt are using some form of observability and/or monitoring solution. These tools, often called APMs, allow you to view critical Node.js performance metrics about your running application.
Getting up and running with an APM
APMs come in different shapes and sizes, all with different features, price tags, security implications, performance, you name it. It pays to shop around a little to find the best tool for your needs. It’s these tools that are going to give us the insights and data we need when we run our Node.js performance tests.
So, if we know we should monitor our application—what exactly should we be monitoring?
Ideally, you want as much data as possible—but as much as we love data; we have to be realistic about where to start! The best place to start is with the following three areas:
- Aggregated logs—Application logs emit either implicitly by some libraries or explicitly by a developer for getting an insight into an application. Most aggregated log tools allow you to easily search and visualize your logged data. In our case, we could log out the performance of each of our APIs and plot them on a graph.
- Infrastructure insights—Your application will run on a host of sorts, so you’ll likely want to see all the data. If you’re running in the cloud, most providers give you this data (albeit in a crude form) out of the box. The data you’ll get from these tools will cover things like CPU and memory usage of your host, connection data, etc.
- Application monitoring—This type of tool usually sits within your application code and can draw insights about how functions are performing/being called, what errors we throw, etc.
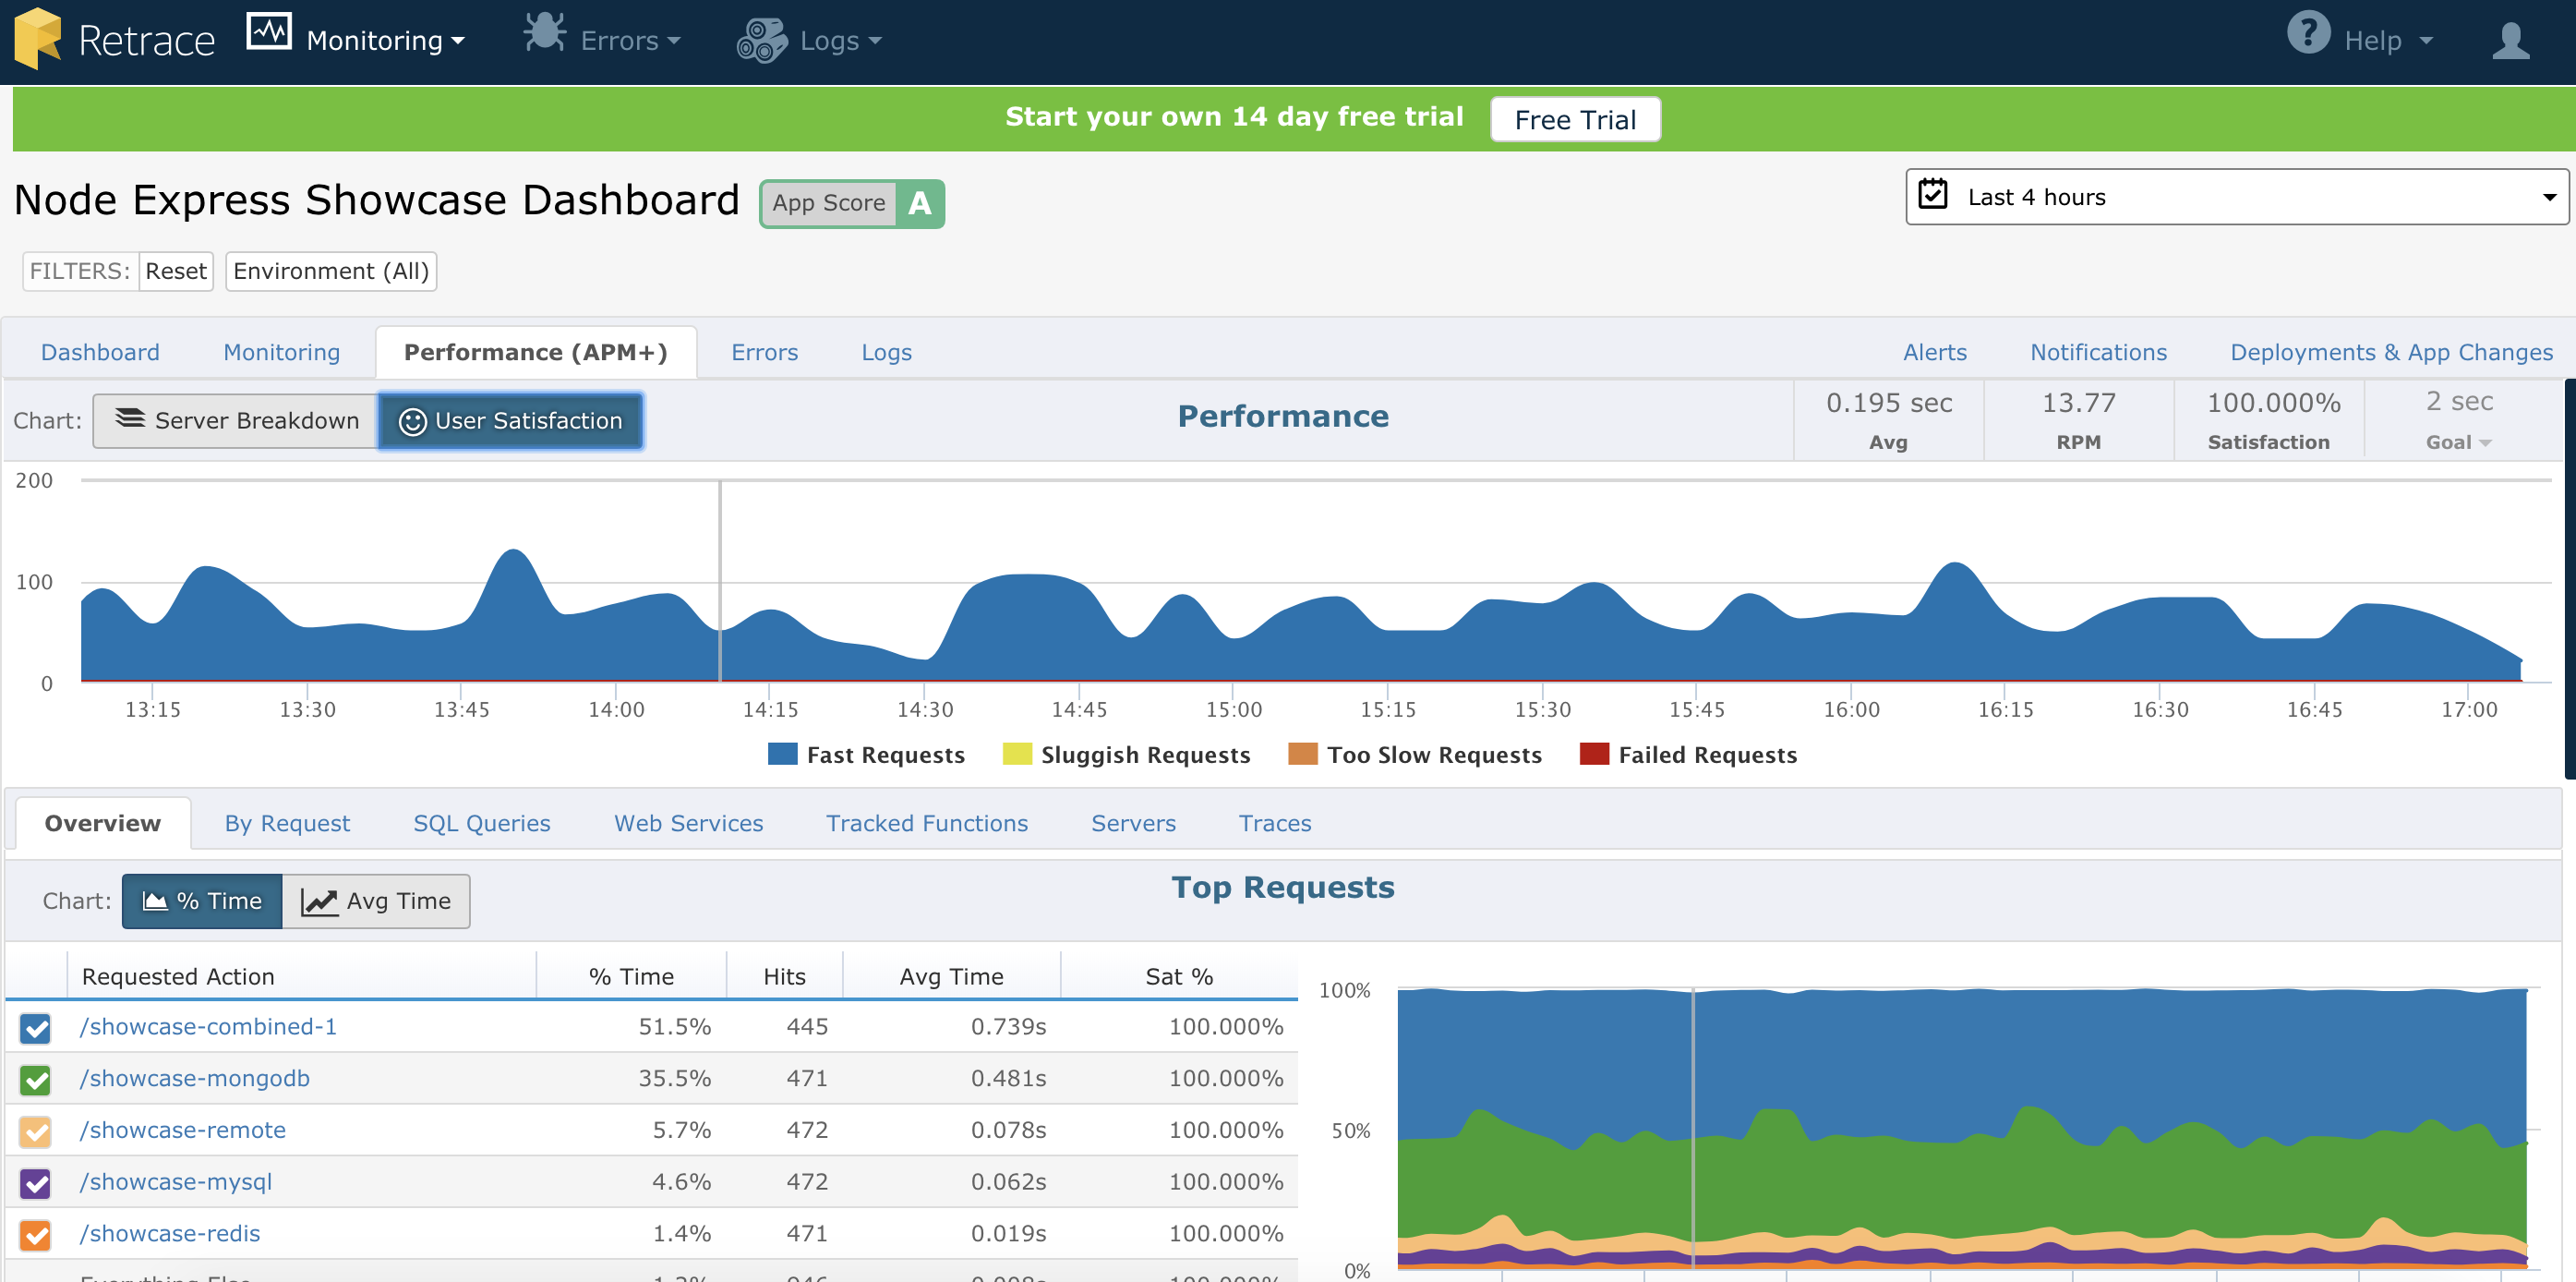
Some APM tools, like Retrace, have all or most of these three features rolled into one, whereas others can be more specialized. Depending on your requirements, you might want one tool that does everything or a whole range of tools for different purposes.

Tooling tailored to Node.js
On top of tools, we can also include other Node.js-specific tools and profilers, like flame graphs, that look at our function execution or extract data about our event loop execution. As you get more well-versed in Node.js performance testing, your requirements for data will only grow. You’ll want to keep shopping around, experimenting, and updating your tooling to really understand your application.
Now we’ve set up our tooling, got realistic profiles for our performance, and understood our application performance, we’re nearly ready to run our tests. But before we do that, there’s one more step: creating test infrastructure.
Step 4: Create Node.js performance test infrastructure
You can run performance tests from your own machine if you wish, but there are problems with doing this. So far, we’ve tried really hard—with our test profiles, for instance—to ensure that our performance tests replicate. Another factor in replicating our tests is to ensure that we always run them on the same infrastructure (read: machine).
One of the easiest ways to achieve a consistent test infrastructure is to leverage cloud hosting. Choose a host/machine you want to launch your tests from and ensure that each time you run your tests it’s always from the same machine—and preferably from the same location, too—to avoid skewing your data based on request latency.
It’s a good idea to script this infrastructure, so you can create and tear it down as and when needed. They call this idea “infrastructure as code.” Most cloud providers support it natively, or you can use a tool like Terraform to help you out.
Phew! We’ve covered a lot of ground so far, and we’re at the final step: running our tests.
Step 5: Run your tests!
The last step is to actually run our tests. If we start our command line configuration (as we did in step 1), we’ll see requests to our Node.js application. With our monitoring solution, we can check to see how our event loop is performing, whether certain requests are taking longer than others, whether connections are timing out, etc.
The icing on the cake for your performance tests is to consider putting them into your build and test pipeline. One way to do this is to run your performance tests overnight so that you can review them every morning. Artillery provides a nice, simple way of creating these reports, which can help you spot any Node.js performance regressions.
Now you have lightning-fast Node.js
That’s a wrap.
Today, we covered the event loop’s relevance for the performance of your JavaScript application, how to choose your performance testing tooling, how to set up consistent performance test profiles with Artillery, what monitoring you’ll want to set up to diagnose Node.js performance issues, and, finally, how and when to run your performance tests to get the most value out for you and your team.
Experiment with monitoring tools, like Retrace APM for Node.js, make small changes so you can test the impact of changes, and review your test reports frequently so you can spot regressions. Now you have all you need to leverage Node.js performance capabilities and write a super performant application that your users love!
Improve Your Code with Retrace APM
Stackify's APM tools are used by thousands of .NET, Java, PHP, Node.js, Python, & Ruby developers all over the world.
Explore Retrace's product features to learn more.
Learn More


