Why You Need Deployment Tracking In Retrace
By: meganhorton
| September 29, 2017

In conversations with our customers, a common requirement is how to identify when things start “slowing down”, or “behaving like an angry nerd who missed out on free LaCroix”. The questions usually continue and developers start wondering about the deployment process. Sure, we all know it “worked on your machine”, but what is it doing in Staging, QA, or Production? Who knew that “good code” still broke in other environments? We do, and we are pros at breaking code. It is what led our founding nerds to develop Retrace, and our current nerds to implement Deployment Tracking as its newest feature.
“What does deployment tracking do for me?”
Deployment Tracking is extremely valuable since you have the ability to see when deployments happened, what environment they happened in, and how they affected your application’s performance. There will be visual indicators on your timelines within Retrace when these events took place and you can easily use them to drill down into metrics that will give you an exact idea of what is happening in your application. These metrics can lead to quicker troubleshooting, or just give you the proof that some things aren’t always the developer’s fault!
I love to talk about deployment tracking with our clients because after explaining it, people all around the conference table start making eye contact and nodding. I quickly hear feedback that this would be valuable to their team and usually a scenario of when it would have been really handy. Let’s be honest, nothing unites or divides a team like a deployment straight out of your nightmares.
Aren’t you glad your customers don’t have visuals of what it takes to keep your application up and running? It isn’t always the pretty picture that makes the company holiday card. Wouldn’t it be fun to add a new caption to that card this year, “We might be smiling now, but you should have seen us at 2 am two months ago… not good… but happy holidays and you are welcome.”
“I like this idea, how do I see it in Retrace?”
Deployment information can be viewed from inside the App dashboard. Simply click ‘Deployments’ to navigate into the deployments tab.

Once inside the ‘Deployments’ tab you will be able to view your entire deployment history.

“Can I see graphs?”
We like graphs and visual information. Once customers begin using the deployment tracking API, they will be presented with data indicating when the code was released in many of the tables, charts, and graphs throughout the Retrace portal. This helps to rapidly identify whether a problem is directly attributed to released code. Deployment tracking is available for production and pre-production environments.
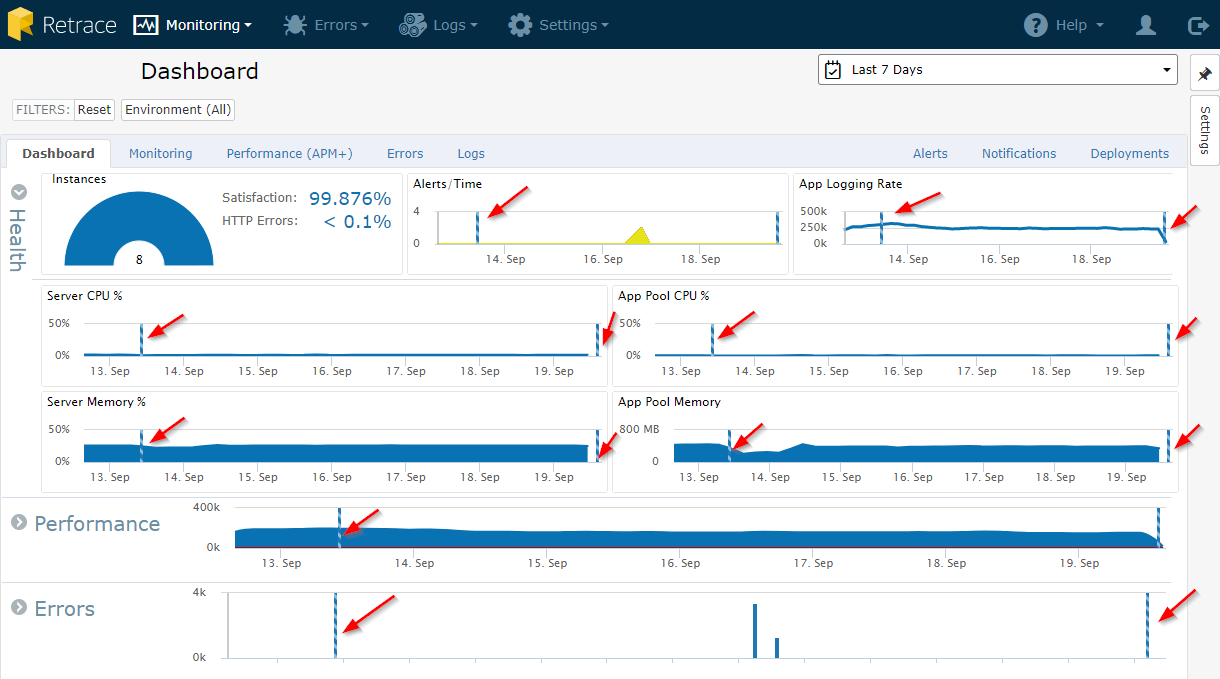
Here is an example of what it looks like in the Dashboard view (the red arrows are pointing to the deployment markers):

I know that is a lot of red arrows but how cool that you can see it everywhere! The deployment markers are visible on all the timelines and could quickly show you if a certain area of your application was affected directly after a deployment.
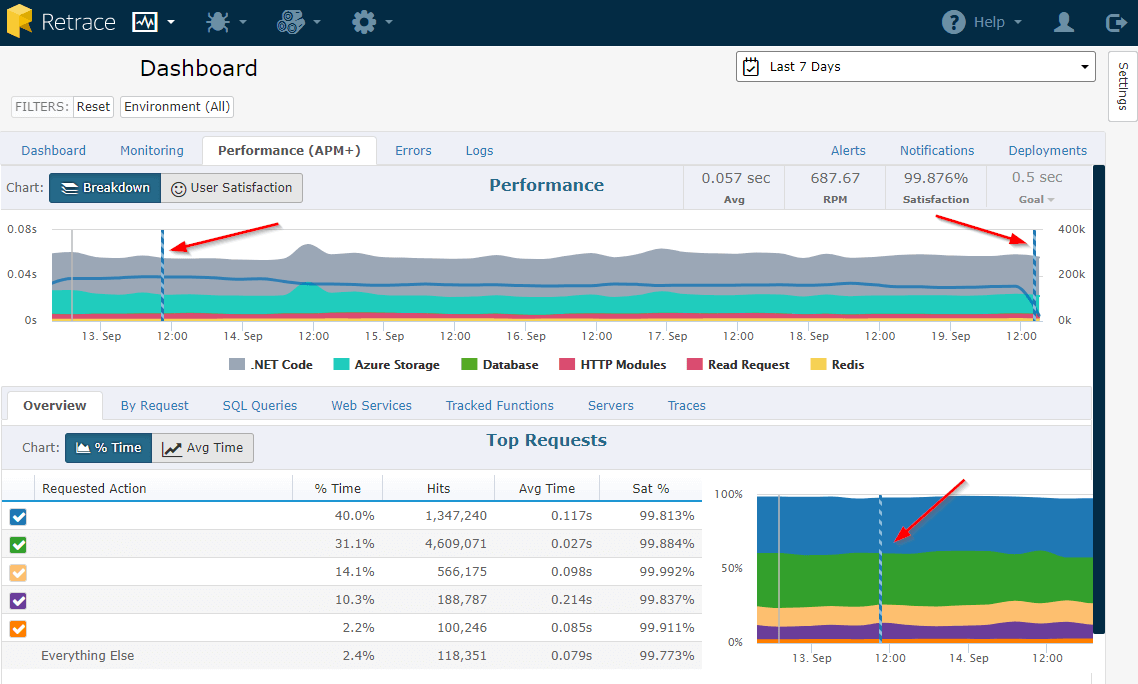
Here is an example of what it looks like in the (Performance (APM+) view (the red arrows are pointing to the deployment markers):

The deployment markers will be color-coded to specific environments so it is even easier to see the whole picture of the application. The example shows that there was a production deployment on September 13 and another one on September 19. It also shows the correlating deployment marker in the top requests chart.
[adinserter block=”33″]
“How do we make this happen?”
Retrace offers several ways to implement Deployment Tracking.
Option 1: Integration With Your Favorite Deployment or CI/CD Tool
One of the easiest ways to get started with Deployment Tracking is by using the direct Retrace integration with your favorite tool. Retrace supports out-of-the-box integrations with the following platforms:
AppVeyor
Atlassian Bamboo
AWS CodePipeline
CircleCI
Jenkins
Octopus Deploy
TeamCity
Visual Studio Team Services
Option 2: The API
If you didn’t find your deployment tool of choice in our list of integrations, or if you need to roll your own integration due to some complex requirements, you may want to check out our API. While the API has been kept intentionally simple for easy use from a variety of build servers and scripts, it does feature Begin/End/Rollback functionality to allow for both completed and terminated deployment scenarios, as well as an atomic “Deployed” call for simpler use cases.
Find more information about deployments of app versions in specific environments with ClientWebAPI code samples using Bash (cURl) and PowerShell here.
Option 3: Manual Deployment Additions within Retrace
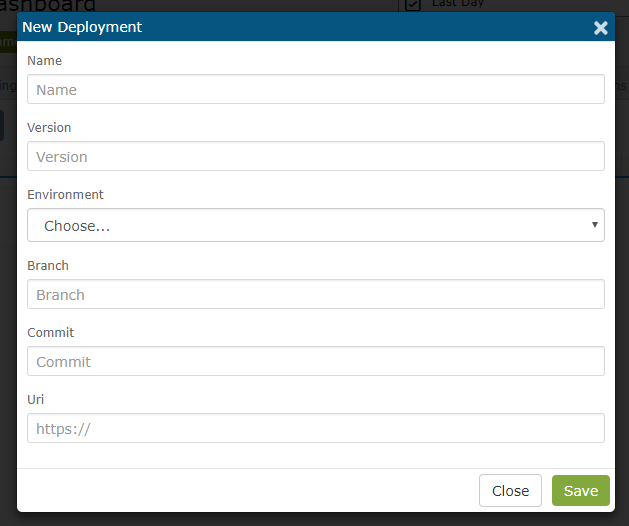
Retrace also provides an option to directly enter deployment information from the Dashboard. Deployments created using the UI bypass the request pipeline and are immediately accepted as valid deployments. It is as simple as clicking the ‘New Deployment’ button.

Enter the deployment information into the ‘New Deployment’ form and click Save.

It will add a vertical line to your timelines associated with the specified deployment information.
“Thanks, Stackify Nerds!”
You are welcome! We happily tested out this new feature and we love it. We hope you do too. We would love to hear how you are implementing this feature or if your development team had a win because of it.
Improve Your Code with Retrace APM
Stackify's APM tools are used by thousands of .NET, Java, PHP, Node.js, Python, & Ruby developers all over the world.
Explore Retrace's product features to learn more.
Learn More


