You checked a few endpoints, and they work as expected. You can log in and see the generic home page. There aren’t any exceptions in the logs—or at least any new ones. Great!
But what does that mean for your customers and partners? Does everything work for them?
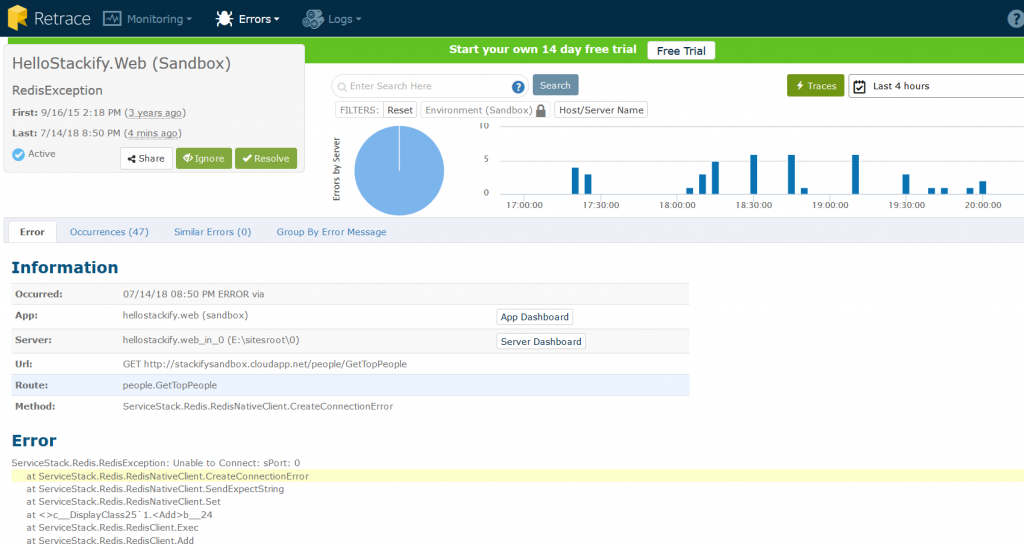
And what about when things do go wrong? Are you the first to know? Or do you only know there’s a problem when your customers tell you something’s wrong? When that happens, are you able to diagnose the issue quickly?
There is more to proper monitoring than simply making sure your servers are up.
Your monitoring solution should give you confidence that:
That all sounds great, doesn’t it? But how do we make that happen?
First, let’s start with the basic question of whether your app is up or not.
Whether you have a web app, backend APIs, or a batch processing system, you need a way to know if your server is up and running.
At the very least, knowing your app is working gives you the peace of mind that comes with knowing customers can access it. Some frameworks provide this sanity check for free, like Spring Actuator and its health endpoint.
You can also roll your own lightweight version. Just create a simple endpoint that logs and returns an HTTP status of 200 whenever it is hit. If it doesn’t return a 200, you know something is wrong.
This is an understandably simple check to see if your system is running. It verifies your app is in some way accessible, but it doesn’t guarantee that anything works. Still, it’s a start.
What else do you need to track?
Also Read-https://stackify.com/feature-flags-and-how-to-use-them-in-software-development/
Sure, your app is up. But what about its dependencies?
Can it reach the database or the email server? If you only have a basic health check endpoint, then you don’t know if just part of your system is down. All you know is one big, glaring symptom. For additional confidence, add dependency monitoring to your health check.
Now, you could customize the health check you created above to check on your dependencies and make things more granular. (Pro tip: Make sure all your web clients can talk to their servers. Do a “Select 1” on your databases, etc.). But to make sure you’re spending your time well, let your APM solution take care of dependency monitoring for you.
In addition to knowing whether your database is up or down, you can also monitor the performance of specific queries against your database.

Your application lives on a server. So you also need to monitor server metrics to make sure everything is running properly.
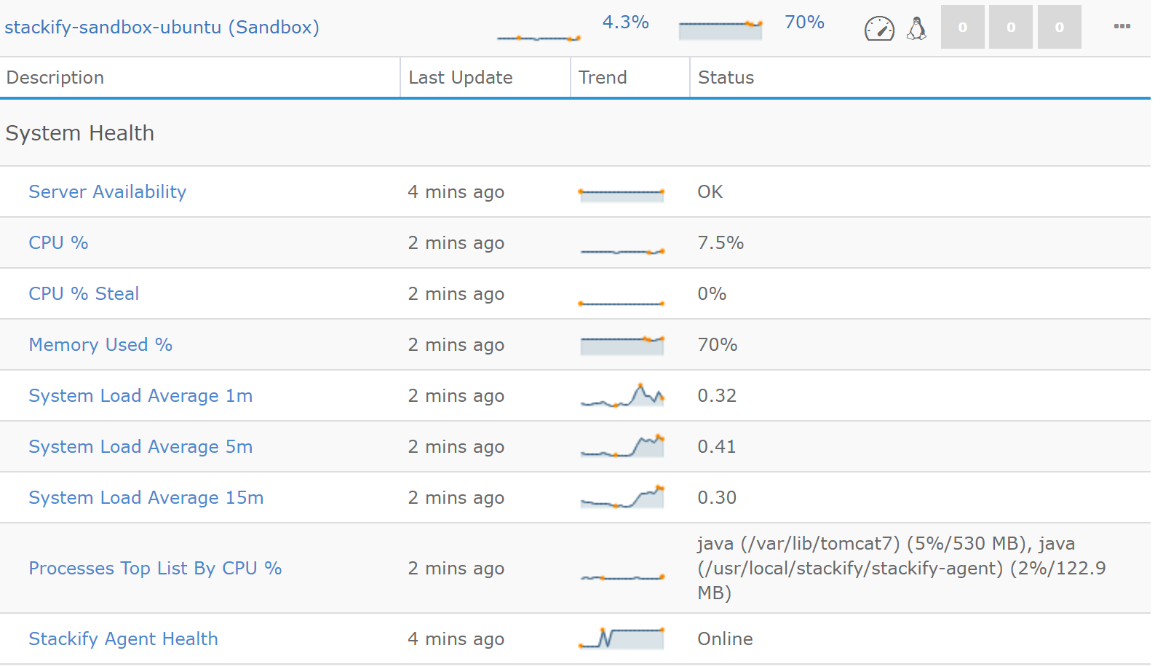
Besides knowing whether the server is up, the application is running, and dependencies are all set, what else should we monitor?
Google’s often-referenced SRE handbook mentions the four golden signals. How does that look when we’re using Retrace?
Latency tracks how long processes take. Using latency on its own, however, doesn’t provide the best picture of how fast your application is running.
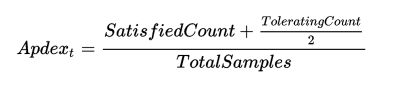
Many monitoring systems encourage you to use Apdex scores to measure latency. Apdex scores help you see not only what your latency is, but also how much of it is acceptable and how much is too slow. With that information on hand, you can then hone in on the worst offenders to see if there are underlying issues with your application.
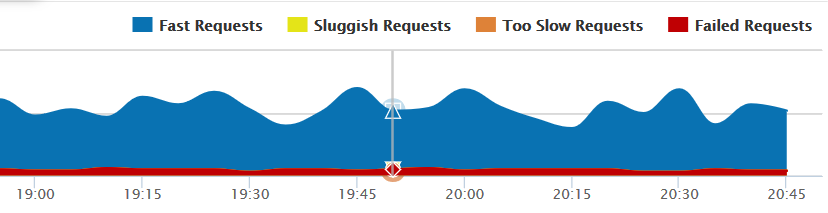
Traffic, or request rate, will tell you how many calls you’re getting. Things can get especially interesting if you correlate request rates to other metrics like CPU, error rates, and failed requests.
If things seem to be working as expected but your logs are full of exceptions, then something’s not right. And no, the solution here isn’t just swallowing those exceptions and moving on.
Perhaps there is a use case that you’re not testing. Maybe there’s a problem lurking that you won’t discover until the month ends. Or perhaps you’ll comment that “this should never happen” or “we’ll never get here, so we don’t need to worry.”
Sure.
Report exceptions. And report them with enough information to get the adequate context.
And when you’re done reporting, monitor for trends and conduct root cause analyses.
If you have an exception that is occurring repeatedly, drill in and get additional info on when and where it’s occurring. Take a look at related logs to see what conditions create it.
Consumer metrics attempt to gather all kinds of data from your customer’s viewpoint.
What functionality are they using? What errors are they getting? How are they using the system?
This can also prune alerts that don’t affect the customer. For example, if one instance of an application is down, proper load balancing should mean that your customer is unaffected. So an alert on an instance being down doesn’t help that much on its own.
However, a periodic 404 or 500 from the consumer side should alert someone that something is wrong.
A key performance indicator (KPI) is a metric tied to the success of your company, organization, team, or application.
What system or application metrics can be tied to your success? What metrics signal that you won’t be able to meet your objectives?
I’d love to tell you exactly what your KPIs are. Unfortunately, it’s not that easy. Only you, your team, and your stakeholders can determine your KPIs. You know your organization better than anyone else, after all.
For companies like Amazon, a major KPI could be sales per minute. For Google, maybe it’s ad earnings per minute. If your application charges based on usage of APIs, it would be API calls per minute.
Monitor these metrics and watch the trends over time. Are they going up or down? And what other metrics do they correlate to?
These are all typically some metric value per some period of time.
Keep in mind that not every metric has to be a KPI, and it’s important to focus on just a few KPIs to ensure that your application is fulfilling its goal. Otherwise, you may end up drowning in data.
You do want to monitor all the things. But you also need to know which metrics are important.
Don’t worry if there isn’t a dashboard or view of every single metric your application produces. You probably won’t need to scrutinize all of them.
And you don’t want screens upon screens of graphs and logs to go through. Make sure your KPIs and high-level stats are visible on a radiator and leave the rest for analysis and debugging.
Alternatively, you could use one metric to summarize your application’s performance for your team and client. Retrace’s App Scoring is a proprietary metric that combines many factors of an application’s performance into a single “letter grade” benchmark score. Users of Retrace can now see at a glance how their application is performing over time.
Still confused as to what to monitor? That’s OK. Start with these guidelines. Retrace automatically measures and tracks important metrics by default.
Back in the day, we combed through logs manually with nothing more than grep to find what we needed. We were encouraged to log as little as possible.
Unfortunately, we often found out that what we logged was not enough.
I’ve seen applications where everything is logged. I’ve also seen others where they sure did try to log, but those efforts didn’t actually add any value. Make sure your logs will give you the information you need by following these best practices.
Logging can also help you monitor metrics of things that are hard to track. For example, lock contention can be difficult to monitor. But if you log each time you lock and unlock, your monitoring can identify what is locked and how long the lock is held.
public void lock() {
    resource.lock();
    logger.info("Locking Resource " + resource.getId());
}

public void unlock() {
    resource.unlock();
    logger.info("Unlocking Resource " + resource.getId());
}
So now we have our monitoring down. We know what’s going on in the system and can use that data to identify the root cause and solve problems quickly.
What else can we do to make sure that our customers get the best experience possible?
Trends identify things that may become problems soon. Tipping points mean the problem has materialized.
Do you want alerts once you’ve run out of disk space or memory? Or do you want a heads-up letting you know that you’re approaching full capacity?
For the disk space example above, perhaps this isn’t a “get out of bed at 3 a.m.” sort of alert. But it’s something that should be looked at and addressed. Monitoring trends and alerting on tipping points is great for things like CPU, memory, hosting limits, and disk space.
So how do you know when you’re at a tipping point?
Look at your previous outages. At what percentages or metric values did things fall over? That is the number you don’t want to get to. Create a quick safety net by setting your alert to 80% of that value to start.
Example:
Everything froze when your JVM used 2G of memory
Our 80% value:
2048MB x .80 = 1638.4MB
Observations:
Leading up to it you saw that memory was increasing at a steady rate for the previous few hours. You also noticed that at times your memory does cross
the 80% threshold without an outage, but only for 1-2 minutes at a time.
Result:
Monitor memory and send a warning when you cross 1433.6MB for more than 5 minutes straight.
If you’re lucky enough to not have seen outages related to these sorts of things, make your best guess. Then modify and iterate if the sensitivity is too great.
You can also use alerts for capacity planning. For example, look at tier limits for your hosting plan. I’m going to use the AWS API Gateway limits to identify a potential alert.
The API Gateway out-of-the-box limits to 10,000 requests per second (with some wiggle room for spurts). If you’re expecting growth, set alerts up for when you hit 70–80% of that. When you hit 7,000–8,000 RPS, you can start to look at whether there are things you need do to allow for continued growth.
Again, this isn’t something to lose sleep over, just a little nudge for you to look at future growth.
Think about how often you’ve heard car alarms going off.
What do you do? Do you call someone? Or do you look around for a few seconds and then go about your business?
To prevent the car alarm effect, make sure your alerts are actionable. Ensure the response is appropriate for the level of alert.
What does a warning, error, or critical mean for your application? Who needs to know about it? And what standard processes should be followed for each level?
Before paging for every metric and error ever conceived, think about what the person getting those notices should do. And think about how quickly he or she should do it.
Warning: This means that someone should look into this. It doesn’t mean right now. Typically, you wouldn’t send a page for this type of alert. Instead, send a Slack message or other notification. Then review progress periodically. It doesn’t have to involve an extended conversation. And it can wait for normal business hours.
Error: This is something that needs to be addressed. However, perhaps not right now. For this, send a Slack notification, maybe a page, or maybe create a ticket in Jira or similar systems for someone to review. Perhaps an error only affects one user or a handful of users and it’s not mission-critical. Or maybe the error has an easily identified and known workaround. It’s a problem, but it’s not affecting your KPIs or other high-value metrics.
Critical: Feel comfortable pulling someone out of bed for this. It’s broad, affects many users, and needs attention immediately. You should stop what you are doing and address this now. Other team members and resources should be available and ready to assist if necessary. Management should be notified.
Make sure your team understands each level and uses levels appropriately when setting up metrics and alerts.
You don’t want items that are critical to be overlooked because you’re flooded with warnings or errors. And you don’t want to lose sleep over things that can wait until tomorrow or next week.
What indicates that your alerts are overly sensitive?
An old friend spent her teenage years working at a popular fast food restaurant. There were constant bells, buzzers, and alarms going off at different stations. Even years later, she was unable to hear an alarm or beep that required her attention because she had gotten so successful at tuning out the noise.
If your developers and SREs are starting to resemble my friend, your sensitivity may be too high. To prevent this, periodically review your alerts and metrics. Look at history and identify what needs fine-tuning. Make sure your team receives the right notifications and reacts appropriately.
What you don’t want is a bunch of car alarms that everyone learns to ignore.
Think of this as a flaky test in your CI build. How many people just don’t even jump at a red build if there’s a flaky test that fails 30% of the time? How many people just finally shut off that code quality linter with all the false positives?
If you want to serve up positive experiences to your customers, your application needs to work as expected. It’s that simple.
With the right monitoring tools in place—and an effective alerting system coupled with it—you can increase the chances your app is running the way it should be, all the time. That’s the ticket to happier customers and a stronger organization.
Stackify's APM tools are used by thousands of .NET, Java, PHP, Node.js, Python, & Ruby developers all over the world.
Explore Retrace's product features to learn more.


