
Monitoring hasn’t traditionally been designed for developers or applications. With the rise of cloud computing, PaaS and even serverless applications, developers need to be much more involved in application monitoring. Comprehensive ASP.NET performance monitoring requires monitoring your application multiple ways, from server CPU usage, identifying slow web requests, slow SQL queries, garbage collection metrics, and much more.
In this guide, we are going to cover the essentials of how to monitor your ASP.NET web applications with Retrace.
I think it is first important to point out the not so obvious. Monitoring the performance of your application is not just about things like availability or average page load time. That is a small part of it.
Your application could be running very fast but receiving no traffic.
Your application could be throwing an exception on every page load.
Your application could be working perfectly but your back end process isn’t billing your customers…
Your application could be doing thousands of things that make no sense.
So, remember, performance problems in your application does not always mean it is slow. It can also mean that it is not performing correctly. It takes comprehensive ASP.NET performance monitoring to ensure that your application is performing correctly in every way.
At a minimum, you need to know if your application is online and how it is performing at a high level. Is your site fast or slow? Are customers happy? These are critical questions that you need to be able to answer and monitor at all times.
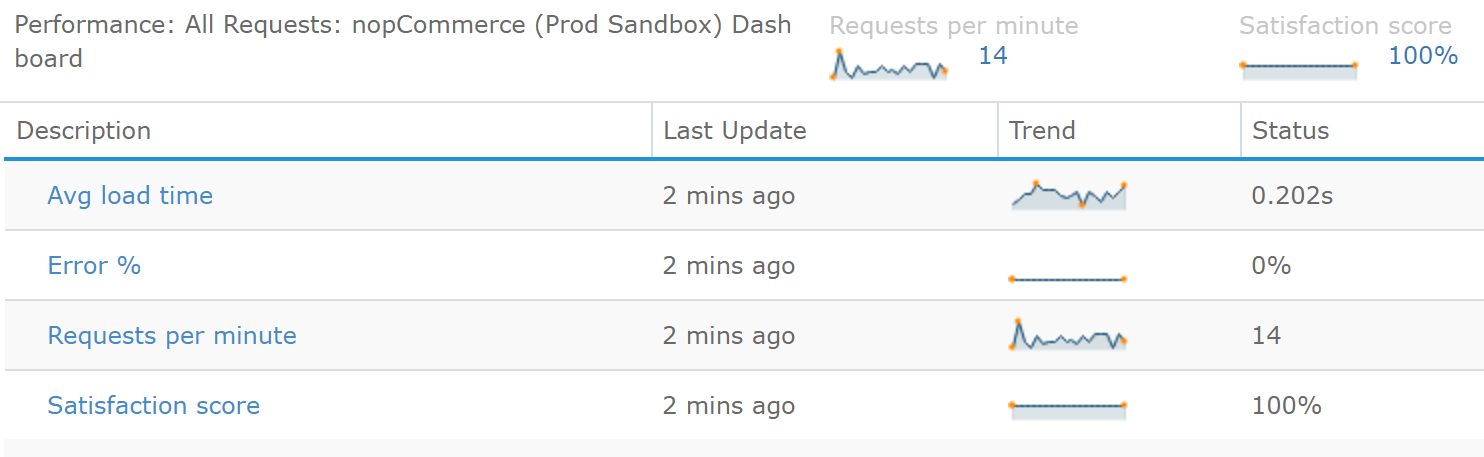
The best way to monitor the performance of your ASP.NET application is with an application performance management (APM) solution. Retrace tracks the performance of your application down to the code level and provides detailed reporting of ASP.NET application performance. That reporting starts with very high-level reporting of ASP.NET performance.
Below are some of the key metrics you can track about an individual ASP.NET application at a high level. Including average page load times, error rates, requests per minute, and a calculated satisfaction score.
Retrace also provides a wide array of other types of monitoring and reporting that we will cover in the rest of this guide.
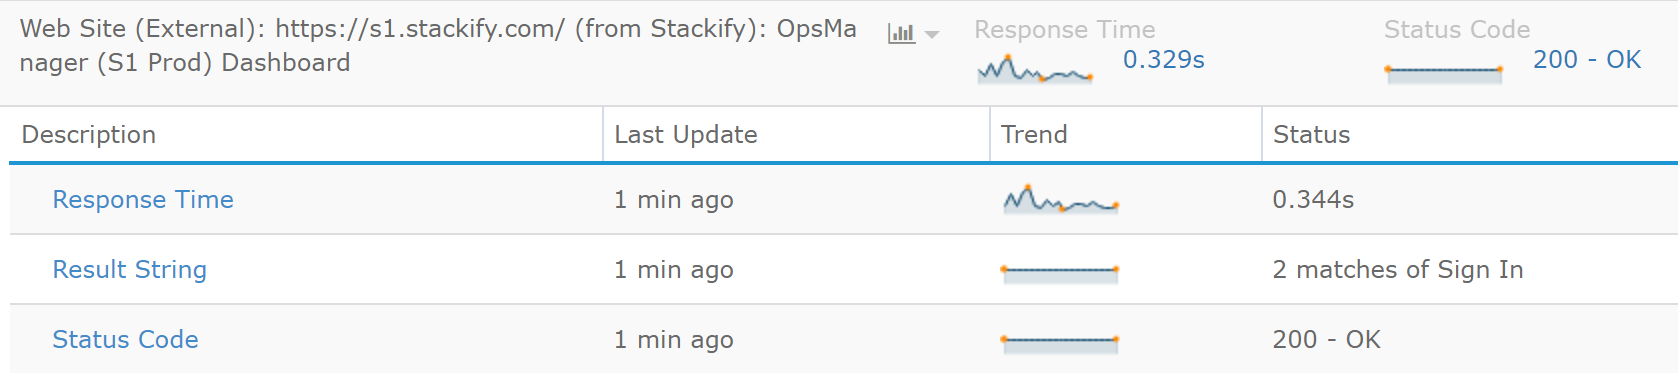
The best way to do this is with a simple HTTP check that executes every minute, or every few minutes. You can then monitor if it is returning an HTTP status of 200, how long it takes, and potentially inspect the response HTML. This type of monitoring also works well as the basis of service level agreement (SLA) reporting.
Every application has web requests that are really important. It could be a high-volume request, a problematic page, or a critical page like a shopping cart. Closely monitoring these “key transactions” is highly suggested. They help ensure that critical functions are working properly and provide a good “pulse” of the overall application as well.
We highly suggest monitoring the satisfaction score of your overall application and specific key web requests. Averages are easily skewed. The satisfaction score is instead based on the industry standard apdex score and provides a better way to track performance over time.
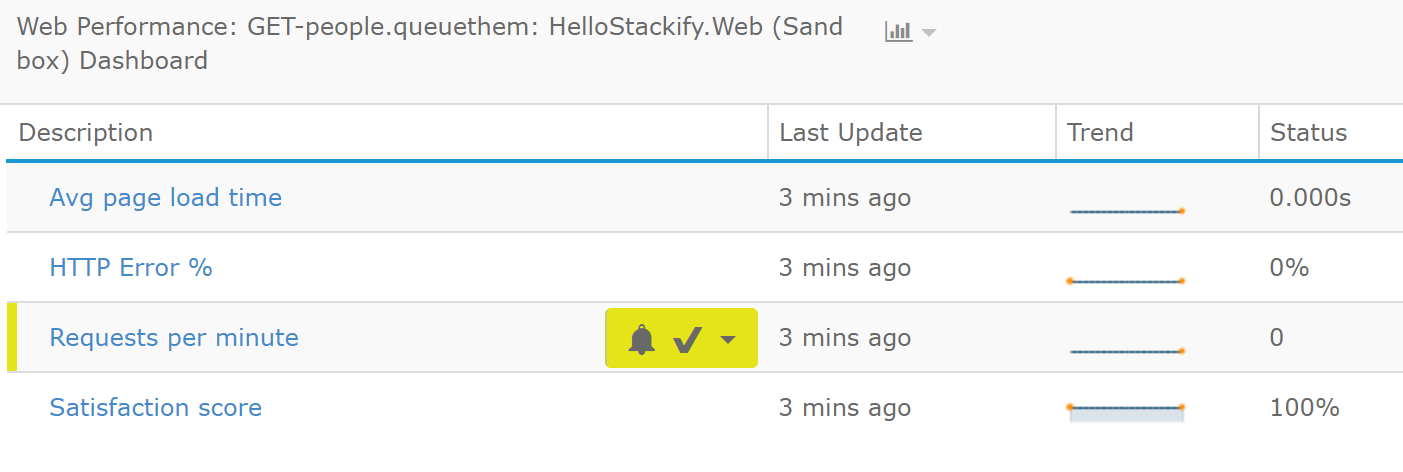
Sometimes it makes sense to simply monitor that your application is getting any traffic. If your traffic drops significantly that could mean there is some sort of serious problem. In this example below, we have a monitor setup for requests per minute being 0. Retrace can monitor any of these metrics.
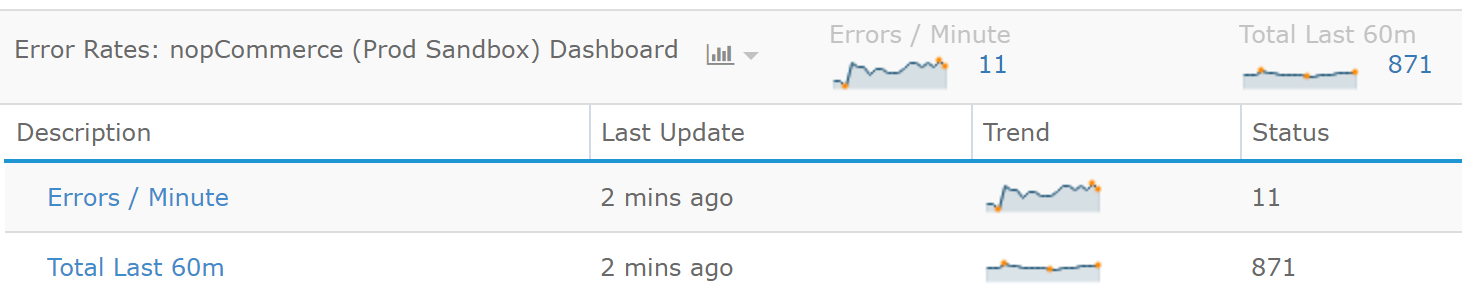
Application errors are typically the first thing that developers look for when things are not working correctly. They can happen for a wide array of issues and can definitely cause performance problems.
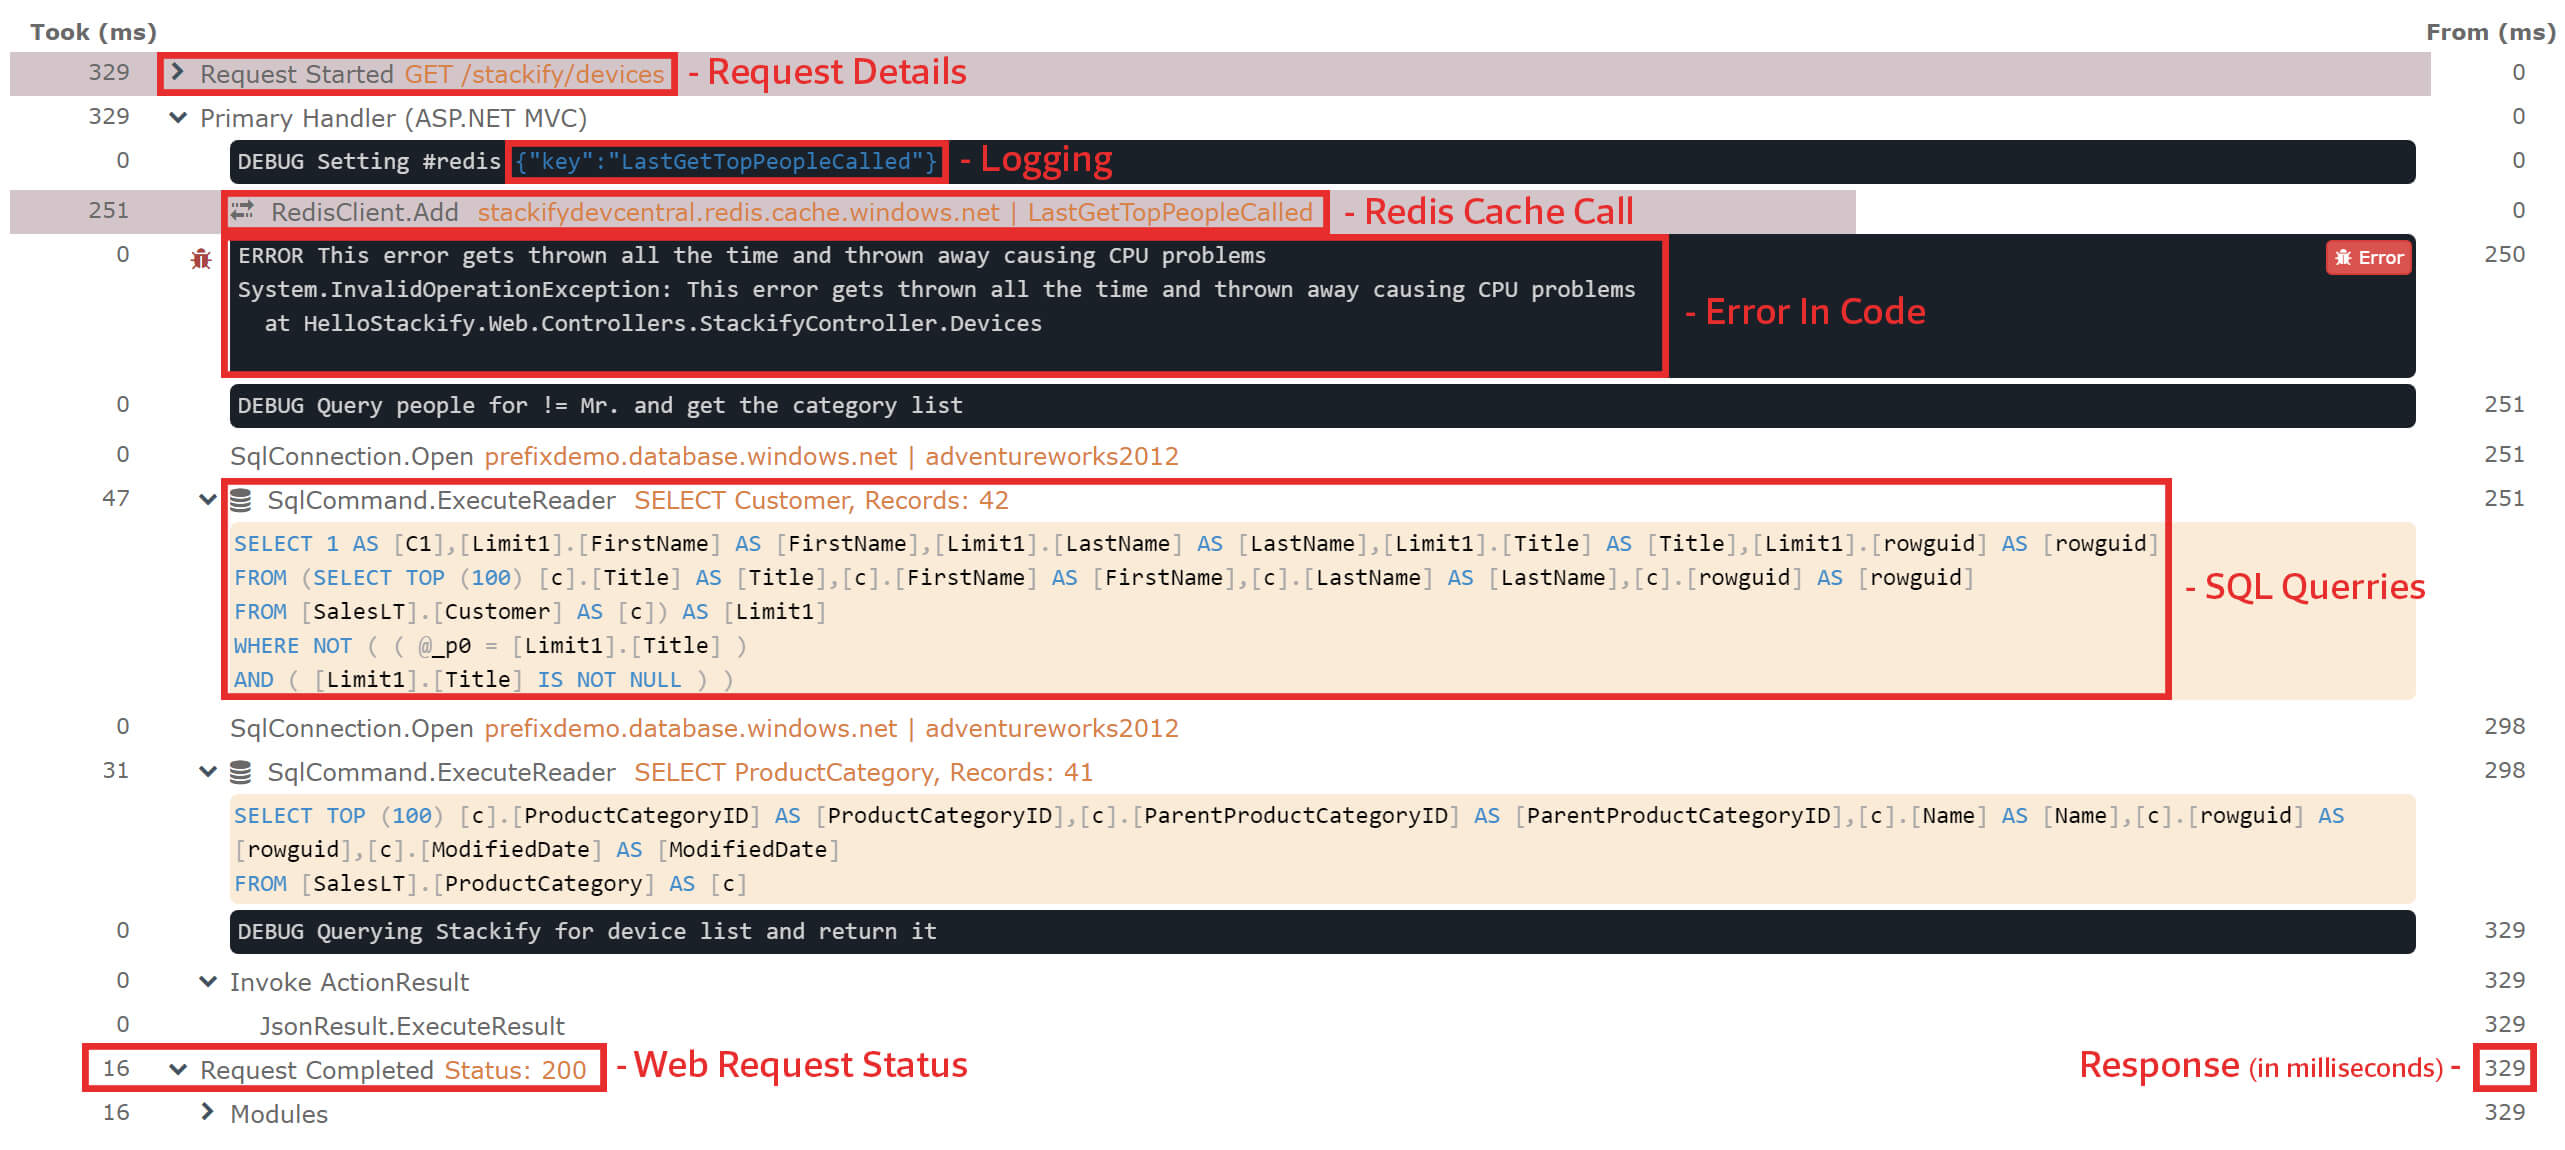
For example, our application was running a little slow a few days ago and we received some monitoring alerts. We quickly noticed a big spike in exceptions.
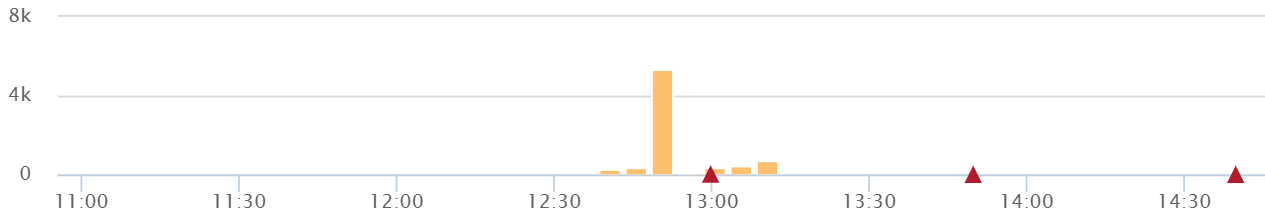
We found that our hosted Azure Redis Cache was having some issues. If we had not been monitoring exceptions we would had no idea that this intermittent issue was occurring.
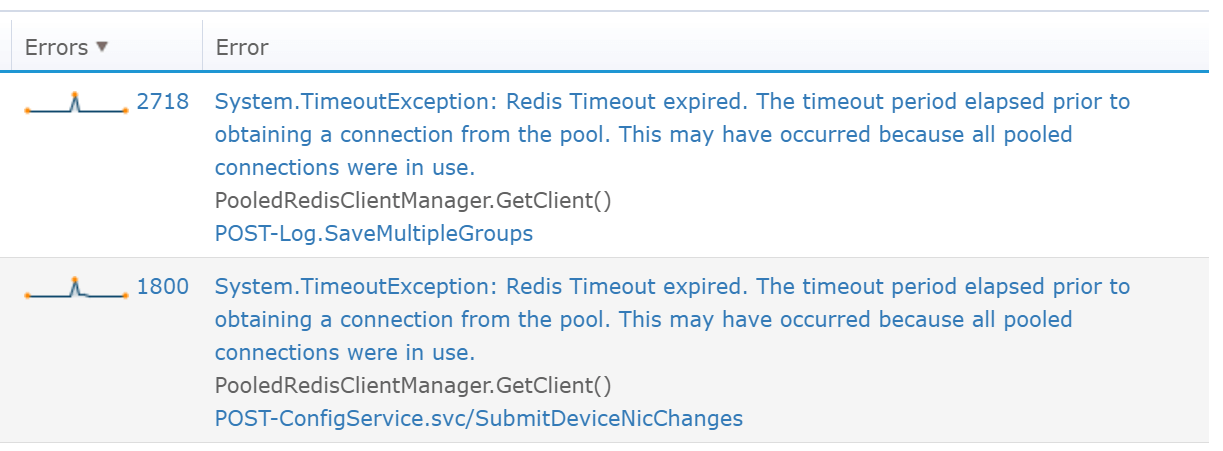
Retrace provides robust error tracking and monitoring. It can send you emails when a new ASP.NET exception is found or when error rates are high. We always suggest monitoring error rates. They provide a good sanity check for detecting weird application problems.
Retrace automatically de-duplicates your exceptions and makes it easy to see what unique exceptions are occurring, how long they have been happening, and much more.
I have worked on many different web applications and they have all relied heavily on a centralized SQL database. There are a lot of scenarios where database problems cause major performance problems within your ASP.NET application. Detailed SQL monitoring is critical to ASP.NET performance monitoring.
Retrace can help you do performance tuning in SQL Server.
Retrace automatically tracks all of the SQL queries being executed by your ASP.NET application. It uniquely identifies each query and removes dynamic data used in the queries.
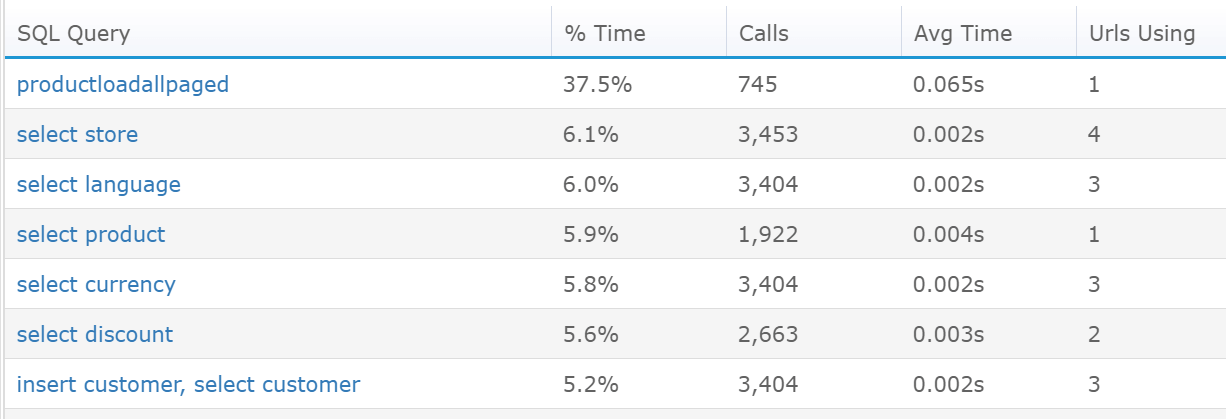
We recently did a deployment of a new application and noticed the requests were a little slow. We found that each web request was causing about 50 SQL queries! The SQL queries were fast, that wasn’t the problem. The problem was that it was making too many SQL queries.
We were able to use this insight to figure out we had a problem in our caching logic.
Retrace allows you to configure monitoring and alerts for a specific query. This is really powerful if you have a specific query that slows down and causes performance problems within your application.
For example, at a previous company, I worked for we had one particular page in our app that was used a lot and the performance of it was critical. It ran some complicated queries to pull back a lot of data. Monitoring that specific query was a good indicator of overall performance.
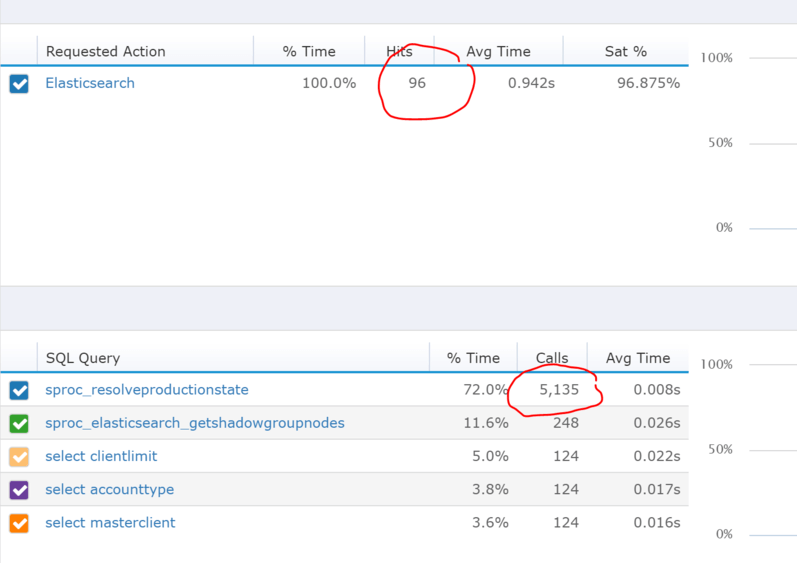
In the previous section, we focused on the importance of monitoring SQL databases and queries. Our applications rely on many other dependencies that can cause ASP.NET performance problems. Dependencies like MongoDB, Redis, Elasticsearch, external HTTP services and many others.
Since Retrace tracks the performance of your ASP.NET application down to the code level, it can automatically identify many common dependencies.
Today’s applications rely on many different dependencies. Utilizing Microsoft Azure or Amazon Web Services makes it very easy to use a wide array of platform-as-a-service offerings.
They make it easy to use various services including caching, SQL, NoSQL, queueing, and much, much more. At Stackify, for example, we heavily using Azure features like Redis, SQL Azure, Service Bus, Table Storage, and Blob Storage.
All of these dependencies add a ton of value for our ASP.NET applications. They also introduce potential points of failure within our applications. It is important to be able to monitor and understand how all of these services impact the performance of our applications.
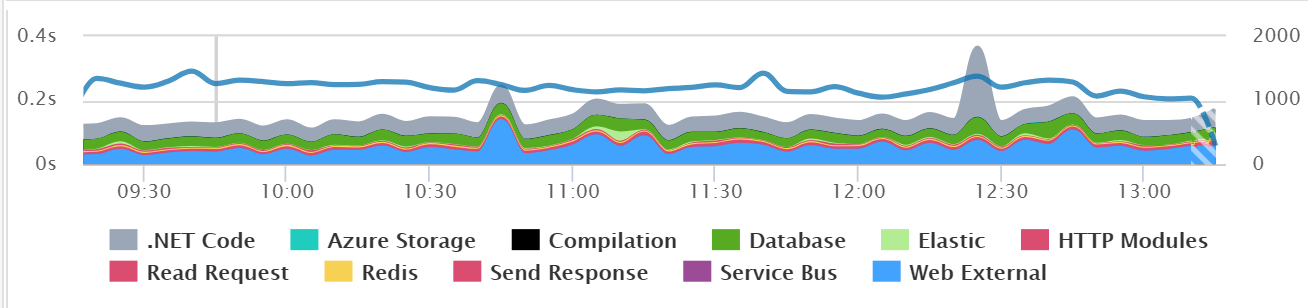
Here is an example below of a typical application that is running fast. Average page load times are under 0.2 seconds which is excellent. We can tell by this chart though that “Web External” is a good percentage of the time taken. So even though there are no performance problems, there might be some room for optimizations and this chart helps point that out.
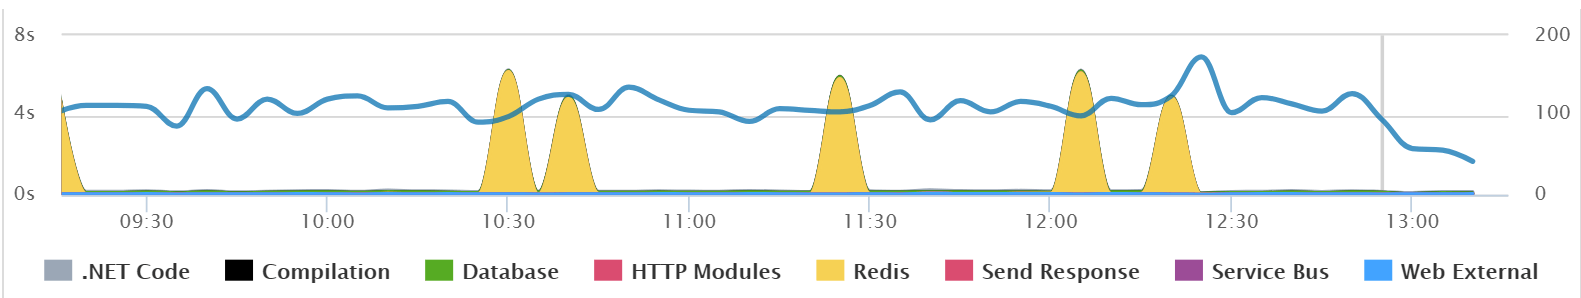
Below is another example of an application that is having some problems with Redis from time to time. You can quickly see the big spikes in performance and that they are directly related to Redis.
One of the keys to ASP.NET performance monitoring is having good visibility to how your entire application stack if performing. Tracking the performance of your application dependencies is critical to quickly identify if performance problems are related to your own code or an external dependency.
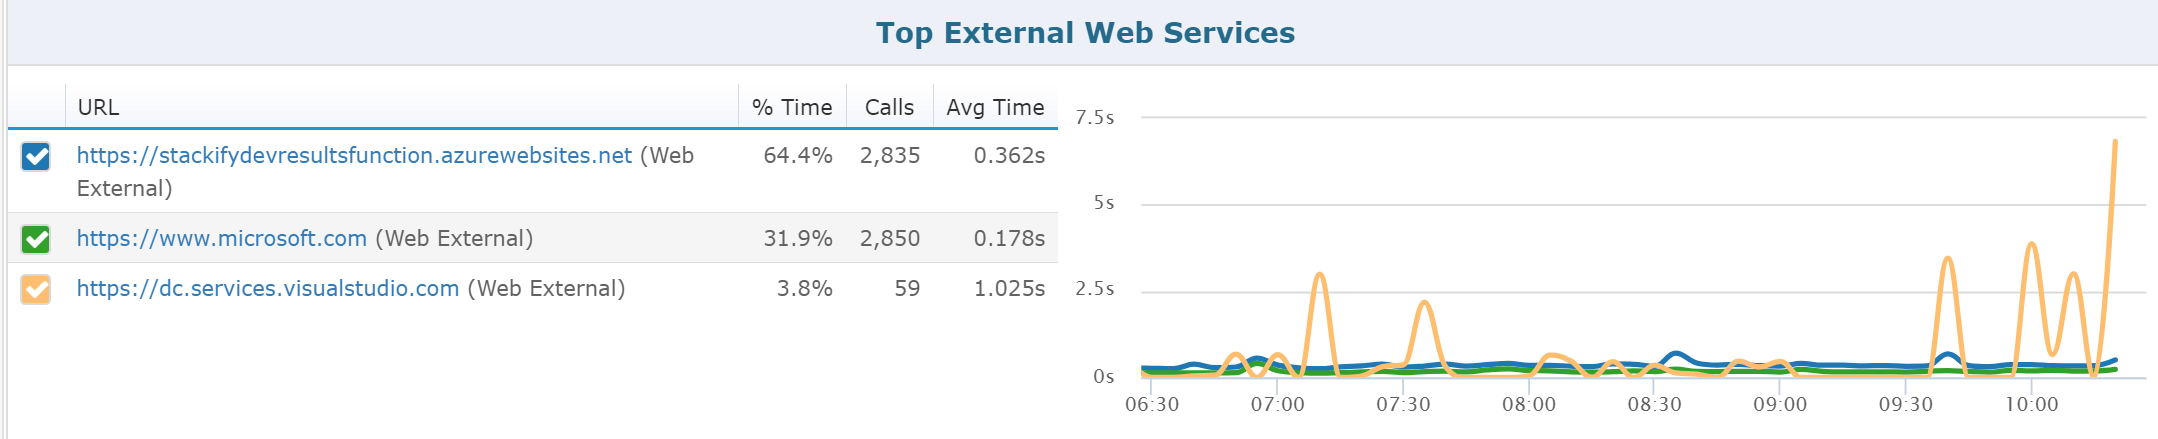
Most applications use some type of external HTTP based web services. These could be for looking up the value of a stock, checking the weather, or a million other possible uses.
At Stackify, for example, we use Twilio and Chargify as key external web services to our system. But we also have integrations with other third parties like Atlassian, Axosoft, Visual Studio Team Services, and others.
In this previous section, we talked about the importance of tracking application dependencies. These HTTP web services are also important dependencies to track. Although, you need more detailed reporting per external web service. Lumping them all together does not help pinpoint a problem among many potential services.
One famous saying is “if it moves, you should measure it”. We are very fortunate that the .NET framework provides a wide array of Performance Counters that we can measure. By monitoring key server metrics, Performance Counters, and our own custom application metrics, we can monitor a wide array of application metrics.
Learn more: 8 Key Application Performance Metrics & How to Measure Them
Monitoring our applications used to mean monitoring our servers. We would monitor if the server was online, CPU usage, memory usage, and if it was running out of disk space.
It would be a huge understatement to say that things have changed dramatically. Modern application performance monitoring tools, like Retrace, have made it easy to monitor our applications and not just our servers.
How we deploy our applications has also dramatically changed. Now we deploy our application to Azure App Services and it auto scales them for us. Monitoring if our server is online also doesn’t make any sense. Azure has hidden servers from us and they automatically handle keeping our servers online.
Server CPU usage is still one of the most important metrics to track. If the CPU on your server is pegged, your application is no doubt going to have performance problems. However, if CPU isn’t a problem and you are having performance problems, you are going to need a lot more detailed metrics to find the problem.
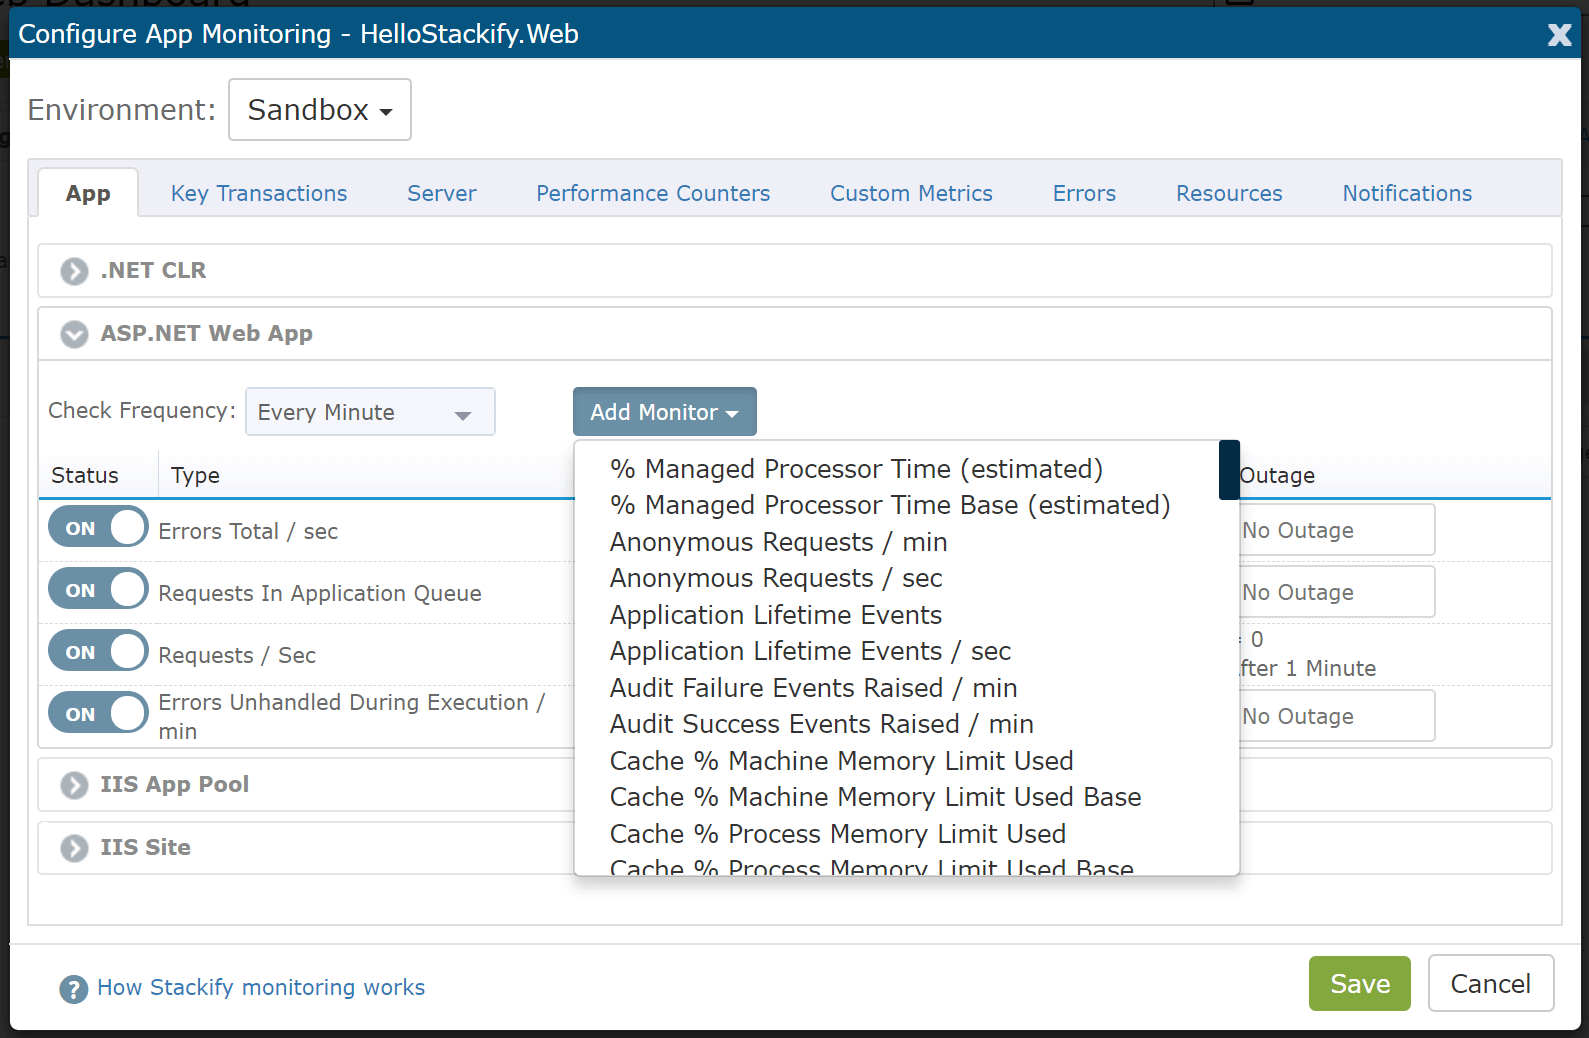
The .NET Framework provides a robust set of Performance Counters that can be tracked about your ASP.NET applications. They range from simple IIS stats like the number of HTTP requests, garbage collection statistics, error rates, and much more.
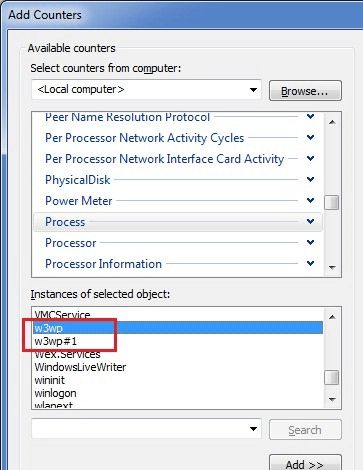
One of the big problems with Performance Counters is actually monitoring them. Many of the performance counters use the Windows process id or name as part of the counter instance name. Since this can change continually, it makes them difficult to monitor.
Which app is “w3wp#1” ?
Also, some Performance Counters only report the # of times something has happened since the server started. This makes it hard to know how many times per second or minute that is occurring unless you track it over time and make those calculations yourself.
Retrace is designed for monitoring Performance Counters. It is able to evaluate dynamically which Performance Counters should be monitored.
By default, Retrace monitors several Performance Counters about your applications. It also provides a simple web-based user interface for selecting additional Performance Counters. You tell us what you want to monitor and we will take care of the rest.
Windows Performance Counters provide a wide array of metrics that can be useful for monitoring your ASP.NET applications. Sometimes it makes sense to create your own custom metrics.
We use a lot of custom metrics at Stackify to understand the usage of our software. For example, what is the average batch size sent to our API? We have an entire article dedicated to this topic with lots of examples that I would recommend reading.
Learn more: When & How to Use Custom Application Metrics
You can create your own Performance Counters with the .NET Framework. If you are using Retrace, you can also use our StackifyLib nuget package to easily create custom metrics.
Monitoring the performance of your ASP.NET application is much more than understanding if it is slow or not. Monitoring custom metrics about your application can help you understand in much more detail how it is performing.
Application logging is important for debugging. It is usually the eyes and ears for developers for troubleshooting production problems. It can also be a goldmine for monitoring things that are otherwise nearly impossible to monitor. Your logs can contain information that isn’t available anywhere else.
If you aren’t using a logging framework like NLog, Serilog, or log4net, I highly recommend it. If you are using one of those logging frameworks, you can also send your logs to a log management tool, like Retrace, and also do advanced log monitoring.
We use log monitoring at Stackify for a lot of things. Here are some examples:
ASP.NET performance monitoring isn’t all about the performance of your code. There are many things that can go wrong with your application that keep it from performing correctly. Monitoring your logs is a great way to keep any eye on those weird scenarios that can be a big problem.
Troubleshooting performance problems in production is hard. Detailed ASP.NET request tracing down to the code level can make it a lot easier. Retrace automatically collects traces of all of your ASP.NET requests. We call it Retrace because it lets you retrace what your code is doing.
If you are looking for the best ASP.NET performance monitoring tools, you are in the right place.
Stackify has two products for .NET developers:
The combination of these helps developers optimize and monitor the performance of their applications from development to QA and in production.
Application monitoring is not something that all developers are experienced with. We hope that this guide helps cover all the basics for advanced ASP.NET performance monitoring. Application performance isn’t just about the performance of your code. It is also important to monitor if your application is performing the task it is designed to do correctly.
Stackify's APM tools are used by thousands of .NET, Java, PHP, Node.js, Python, & Ruby developers all over the world.
Explore Retrace's product features to learn more.


