ASP.NET Performance: 9 Types of Tools You Need to Know!
By: mwatson
| February 19, 2021

One of the best things about being a .NET developer is all the amazing ASP.NET performance tools that can make your life easier. This blog post is a list of the various types of ASP.NET performance tools at your disposal for finding and optimizing ASP.NET performance problems. Depending on the task, some of these tools will be much better than the others.
Performance Tools for .NET and ASP.NET
1. .NET Code Profilers
If you are trying to tweak the performance of your code line by line, a good code profiler is your friend. They work great for those times when you have a console app and want to run a certain method 1,000 times to tweak CPU and memory usage. They also work great attached to existing Windows Services or ASP.NET apps to find the hot paths in your code.
Pros:
- Very deep analysis down to the method and code level.
- .NET code profilers can be used on your local machine and some support remote profiling and debugging.
- They can be helpful to track down performance problems.
Cons:
- Method and code level profiling can really slow down your app while the profiler is running. Not preferable in production environments.
- Not designed to run non-stop for monitoring ongoing performance.
Popular Tools:
2. ASP.NET Performance Profilers & Transaction Traces
I’m not sure how to categorize these, but there are a couple of great options for analyzing the performance of your ASP.NET apps without doing full code profiling. These solutions all capture detailed transaction traces about each ASP.NET web request.
Glimpse and the Miniprofiler work differently than each other but both basically allow you to understand some details about the performance of your app while in development or production. But only for the performance of the current request you are executing, a la, ASP.NET profiling.
Pros:
- These tools are great for basic ASP.NET performance troubleshooting during development and QA-type scenarios.
- Can be useful in production as well with minimal performance overhead.
Cons:
- They only show details about your current request that you are executing. So you can’t really troubleshoot ASP.NET performance problems your users are seeing unless you reproduce the same exact steps.
- They aren’t used for monitoring the ongoing performance of your entire application like an APM solution does.
Popular Tools:
- Glimpse can show you a lot of details about a single web request and the configuration of your server.
- Miniprofiler tracks database queries and can provide more details if you add some code in your app for the steps that you want to track.
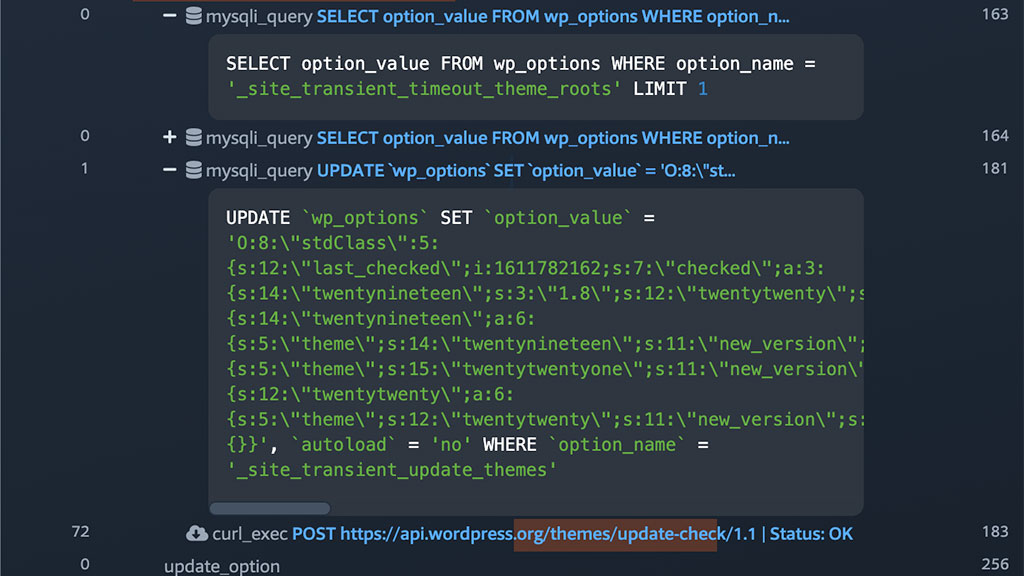
- Prefix provides deep-level performance details about your app. Including all SQL statements, errors, logs, HTTP calls, and details from dozens of other frameworks. Prefix code profiler lets you test and profile your code while writing it.
Review of Prefix: A lightweight ASP.NET profiler helping you write better software
Tools like Prefix can provide very detailed traces of what your code is doing:

3. .NET Application Performance Management (APM)
Application performance management tools offer the best of both of the previous two categories. They are designed to do lightweight code profiling on every single web request that won’t impact the performance of your applications. They can collect the high-level details you need to identify common performance problems and monitor your production apps nonstop to ensure they are always working properly.
Pros:
- Monitor the ongoing performance of your production applications.
- Quickly identify slow web requests, database queries, web services, and much more.
- Can typically be used on any app without code or configuration changes.
- Can be useful in QA-type environments to identify performance problems before they make it to prod.
Cons:
- Can be very expensive.
- Most do not support newer async/await coding patterns.
- Some vendor products do not work with Azure Web Apps or other cloud-type hosting scenarios.
- Many tools can provide an overwhelming amount of information and be difficult to use.
Popular Tools:
- Monitoring .NET applications is much easier with a good APM solution like Stackify Retrace. Retraces lets you integrate code profiling, error tracking, and application logs into your program. But that’s not all. You can improve your code as you write since Retrace can quickly troubleshoot problems and commend ways to optimize your code.
- APM tools in the market are New Relic, AppDynamics, Dynatrace, and others.
Note: Some providers, including Stackify, provide free trials that can be used to help identify immediate problems.
Compare: Stackify Retrace vs New Relic, Stackify Retrace vs App Insights
Read More: Azure Service Profiler review – How does it fit in your toolbox?
How to Monitor IIS Performance
4. Real User Monitoring
Most applications these days use a lot of JavaScript. To track the performance of how long it takes your users to download all of the JavaScript, CSS, and images for your site and render them, you will use a real user monitoring (RUM) solution.
Most APM providers also provide real user monitoring. There are also numerous providers of only real user monitoring, including load balancer providers.
Stackify Retrace provides real user monitoring as part of its performance management solutions. With Retrace’s RUM, you will be alerted when your customers are having poor experiences. Then, it automatically points your UI engineers to how and where it can be fixed.
Read More: Stackify Retrace Real User Monitoring Getting Started
5. Windows Performance Counters
Microsoft provides a lot of built-in metrics related to the CLR, ASP.NET, IIS app pools, and much more. Some of the most important ones when it comes to tracking performance are related to garbage collection, request queuing, memory usage, CPU usage, HTTP error rates, and many more.
Pros:
- Pre-installed on every Windows Server.
- Most server & app monitoring tools designed to collect them for reporting.
Cons:
- Can be hard to match up constantly changing process IDs and names to your app.
- Not available on Azure Web Apps.
- For apps on multiple servers, you need to collect them from each server to compare or aggregate which can be difficult.
Read more: Performance Counters for ASP.NET on MSDN
6. Custom Metrics or Key Performance Indicators (KPIs)
One of the best ways to track the performance of your app is by creating your own custom application metrics and tracking them. If you want to track your own custom metrics, you can make your own Windows performance counters, use statsd, or numerous 3rd party services.
As an example of how you can use custom metrics, at Stackify we use a lot of them to track things like how many metrics or log messages we have coming inbound per minute. We also track how long it takes to process them at every step in the pipeline. These kinds of metrics are very valuable for application monitoring and troubleshooting purposes.
Pros:
- Reporting custom metrics to a 3rd party solution can be simpler than reporting them to a Windows performance counter and then figuring out how to report the performance counter to somewhere. (Eliminates a step!)
Cons:
- Not taking the time to actually create some?!?
How to: Create Custom Performance Counters with C#
Open source option:
Note: Many application monitoring type products may have libraries or an API available for supporting custom metrics as part of a larger monitoring product. Check if your current tools support it.
7. Web Server (IIS) Access Logs
If you want to track how long it takes a particular request to load, you can quickly open or tail your IIS log files. You could even aggregate all of them, parse, and query them to identify your top used requests, slowest requests, etc. Doing this on your own can be complex if you are trying to monitor them ongoing. You can also ship all of your logs to a 3rd party log management tool that is designed to help you search and visualize all of your logs.
If you don’t have an APM solution, parsing your IIS logs is one way to do basic ASP.NET performance monitoring.
Pros:
- Quickly viewing an IIS log file is easy to do.
- Visual Log Parser provides a quick way to do some basic querying against logs.
Cons:
- Doesn’t give you any details as to why the request took as long as it did. The time taken as reported by IIS includes client network time which is longer than just time spent in your code.
- Many apps now use advanced URL routing which makes the URLs very unique and hard to report on (URL rewriting, REST, WCF, etc).
Popular tools:
Read more: 13 Ways to Tail a Log File on Windows & Linux
8. ASP.NET Failed Request Tracing
One of the lesser-known and used features of IIS is failed request tracing. It can be used to trace lots of details about IIS requests that meet certain rules that you can configure. You can set them up for certain HTTP status codes, time taken, or event severity level.
Pros:
- Can be turned on for production servers at any time and turned back off when you are done.
- Good for identifying if a problem is happening, how often and perhaps some details as to why. Helpful for finding problems with HTTP modules.
Cons:
- The output is giant XML files full of lots and lots of information that can be hard to decipher.
- Requires file system access to production servers to view.
- Doesn’t identify performance problems down to the method or code level like profiling does.
9. Exception Tracking
One of the biggest causes of performance problems can be application exceptions. When an exception is thrown it causes the thread to pause while the stack trace is collected. Even handled exceptions that seem innocent can cause huge performance bottlenecks under heavy server load. It is important to aggregate and monitor all of your exceptions to find critical problems, new errors, and monitor error rates over time. Error or bug tracking tools are essential for any development team.
Read more: How GWB Found Hidden Exceptions and Application Performance Problems
Pros:
- Easy to set up if you are using a logging framework like log4net or NLog. If you are not using a common logging framework, you can use Elmah.
Cons:
Learn More: Advanced Error Monitoring, Tracking & Reporting with Retrace
The Ultimate ELMAH Tutorial
Note: Manually catching and reporting errors in your code to a logging framework is a great way to collect errors. But you will likely never cover every single possible way an error could occur by doing so. Many APM providers can also collect errors via the .NET CLR Profiling APIs and that gives them visibility to every single error ever thrown. This method can collect a lot of noisy errors, but this can be really valuable for finding and eliminating unnecessary exceptions you may not otherwise know exist.
Advanced Windows & ASP.NET Monitoring Tools
Some other options that can be helpful in certain situations are ETW, WMI, WinDbg or even the CLR Profiler API itself. Although these are all very low level and require some experience to know what to do with.
WinDbg is a really powerful tool for analyzing weird ASP.NET problems. Check out this blog post where we discuss using WinDbg to solve a problem caused by an async thread throwing an exception.
Conclusion on ASP.NET performance tools
Depending on what you are trying to accomplish, there are a lot of ASP.NET performance tools available to you. Every application problem is different. Over time you will probably use all of the different types of tools listed here. It is really good to at least know what options are available to you and we hope you found this list helpful. Have other ideas that should be on our list? Let us by commenting our pinging us on Twitter @Stackify.
Learn how to put these tools to work: How to Troubleshoot IIS Worker Process (w3wp) High CPU Usage
Need help identifying and monitoring ASP.NET performance problems? Try a free trial of Stackify Retrace or learn more.
Improve Your Code with Retrace APM
Stackify's APM tools are used by thousands of .NET, Java, PHP, Node.js, Python, & Ruby developers all over the world.
Explore Retrace's product features to learn more.
Learn More


